
Data Analysis & Visualization for Business GrowthANNA DUFIE AFRIYIE
I help businesses turn raw data into meaningful insights that drive smarter decisions. Using tools like Power BI, Excel, and Python, I transform complex information into clear visual stories that reveal growth opportunities.
What's included
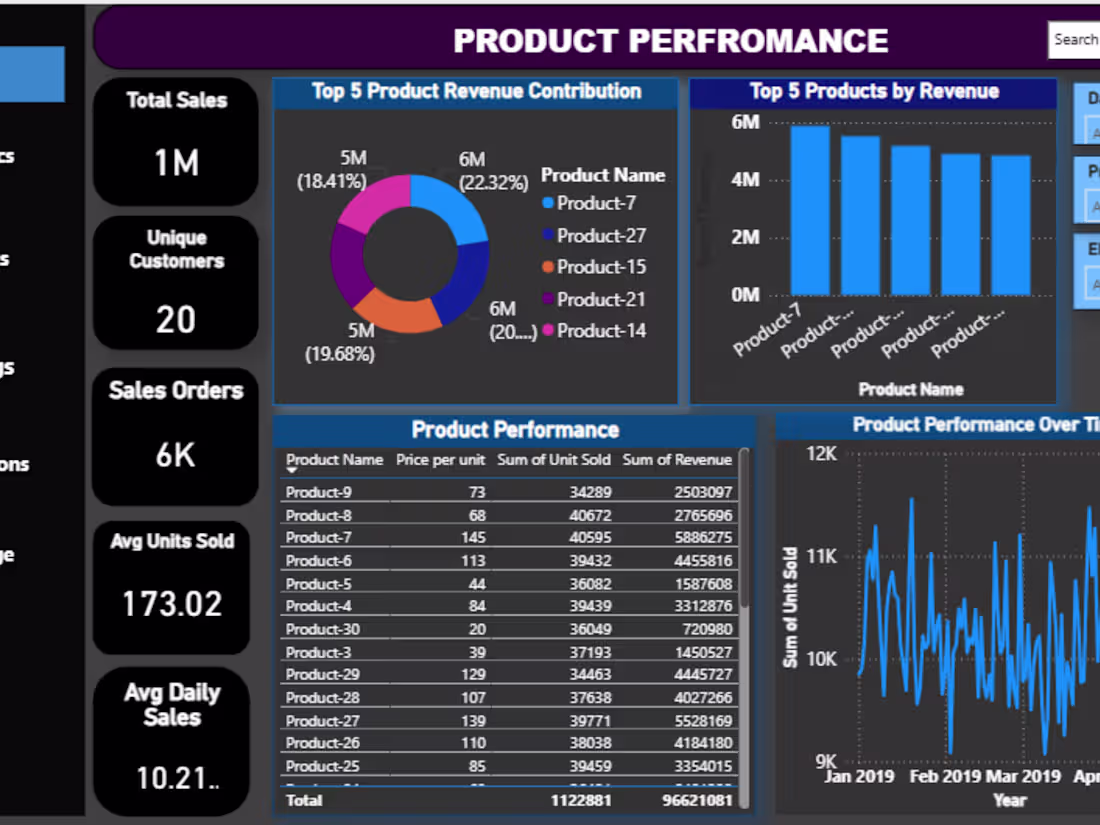
Interactive Data Dashboard
A fully customized, easy-to-navigate dashboard built in Power BI or Excel, visualizing key trends and insights tailored to your business goals.
Data Insights Report
A concise report highlighting patterns, performance metrics, and actionable recommendations based on data analysis findings
Starting at$50
Duration2 weeks
Tags
MATLAB
Microsoft Excel
pandas
Tableau
Data Analyst
Data Modelling Analyst
Data Scientist
Service provided by
ANNA DUFIE AFRIYIE Accra, Ghana
- 13
- Followers
Data Analysis & Visualization for Business GrowthANNA DUFIE AFRIYIE
Starting at$50
Duration2 weeks
Tags
MATLAB
Microsoft Excel
pandas
Tableau
Data Analyst
Data Modelling Analyst
Data Scientist
I help businesses turn raw data into meaningful insights that drive smarter decisions. Using tools like Power BI, Excel, and Python, I transform complex information into clear visual stories that reveal growth opportunities.
What's included
Interactive Data Dashboard
A fully customized, easy-to-navigate dashboard built in Power BI or Excel, visualizing key trends and insights tailored to your business goals.
Data Insights Report
A concise report highlighting patterns, performance metrics, and actionable recommendations based on data analysis findings
$50