
Transform Data, Dashboard Reporting, Forecasting with Power BIReema S
I offer expert data analysis services that transform complex datasets into actionable insights, empowering businesses to make informed decisions. What sets me apart is my commitment to delivering personalized solutions tailored to your unique needs, along with a focus on clear communication and collaboration throughout the process. I have hands-on experience on different business intelligence tools- Power BI, Tableau, Looker, IBM Cognos and Qlik.
What's included
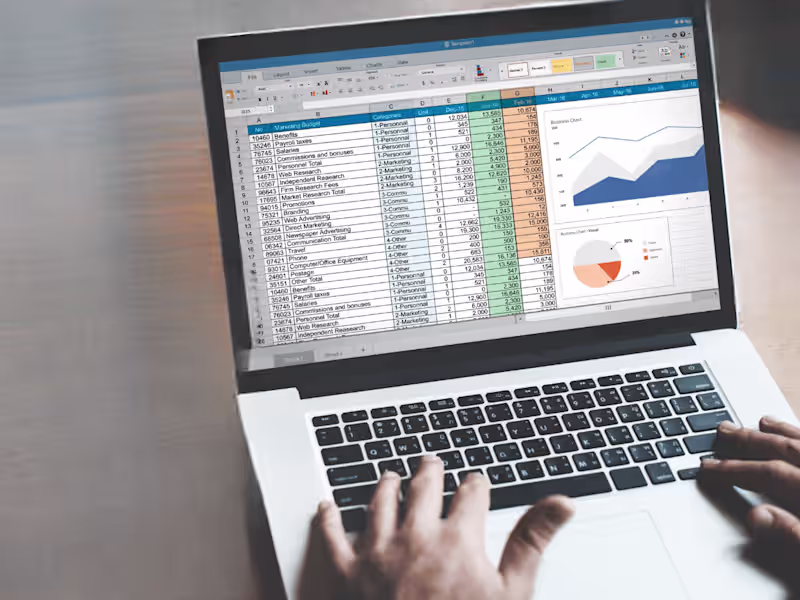
Comprehensive Data Analysis Report
Description: A detailed report summarizing the findings of the data analysis, including insights, trends, and actionable recommendations tailored to your business needs.
Format: PDF and Word document
Quantity: One complete report
Revisions: Up to two rounds of revisions included
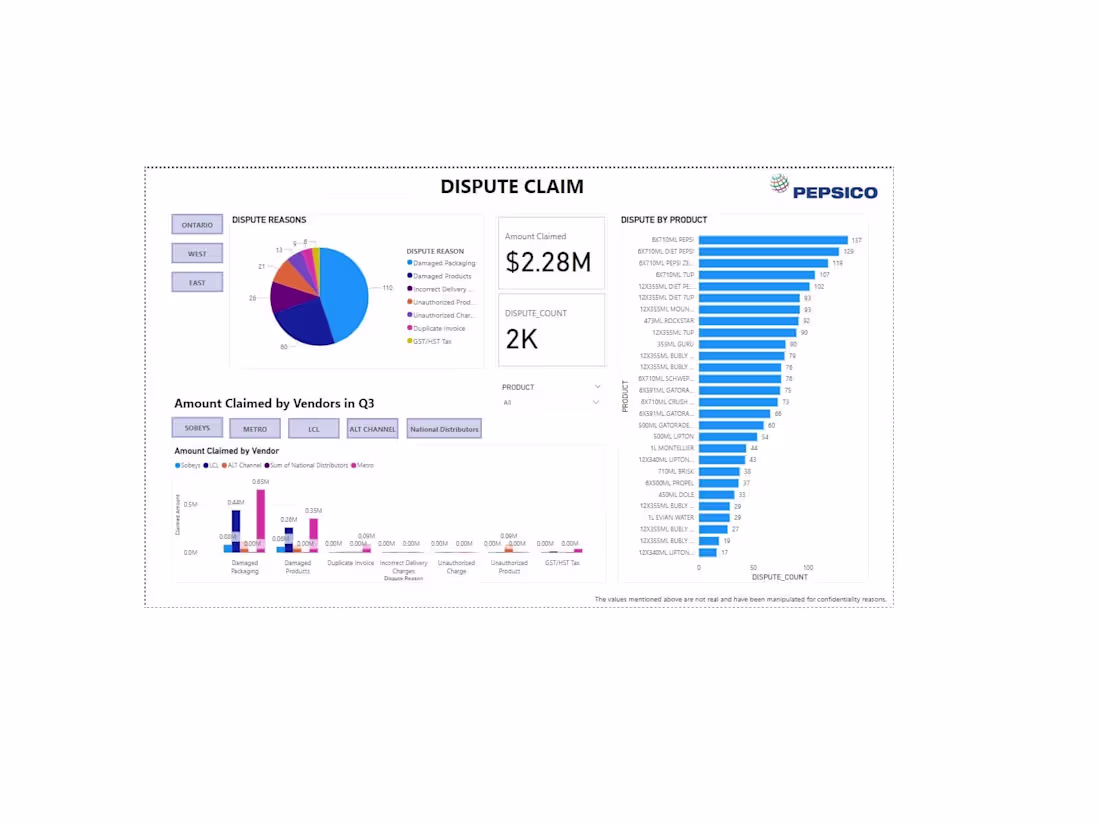
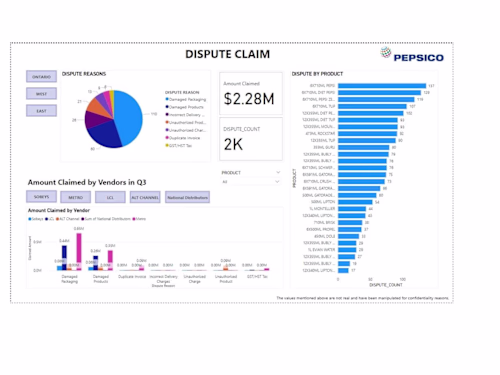
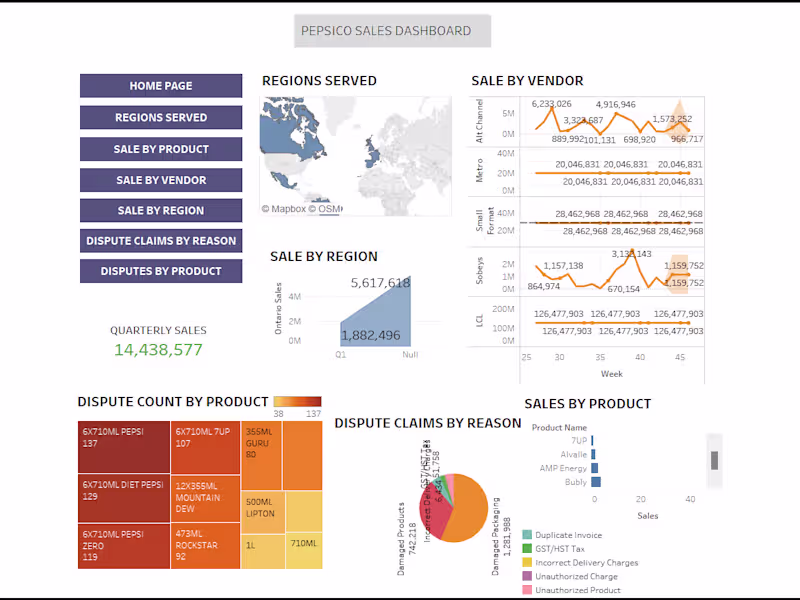
Interactive Dashboard
Description: A user-friendly, interactive dashboard created using tools like Tableau or Power BI, allowing you to visualize key metrics and track performance in real time.
Format: Web-based dashboard link and PDF summary
Quantity: One dashboard
Revisions: One round of revisions for layout and functionality
Presentation of Findings
Description: A professional presentation summarizing the key insights and recommendations from the analysis, designed for sharing with stakeholders and decision-makers.
Format: PowerPoint presentation
Quantity: One presentation (up to 8-10 slides)
Revisions: One round of revisions for content and design
Starting at$50 /hr
Tags
Microsoft Excel
Microsoft Power BI
pandas
Tableau
Data Analyst
Data Modelling Analyst
Data Scientist
Service provided by
Reema S Mississauga, Canada
Transform Data, Dashboard Reporting, Forecasting with Power BIReema S
Starting at$50 /hr
Tags
Microsoft Excel
Microsoft Power BI
pandas
Tableau
Data Analyst
Data Modelling Analyst
Data Scientist
I offer expert data analysis services that transform complex datasets into actionable insights, empowering businesses to make informed decisions. What sets me apart is my commitment to delivering personalized solutions tailored to your unique needs, along with a focus on clear communication and collaboration throughout the process. I have hands-on experience on different business intelligence tools- Power BI, Tableau, Looker, IBM Cognos and Qlik.
What's included
Comprehensive Data Analysis Report
Description: A detailed report summarizing the findings of the data analysis, including insights, trends, and actionable recommendations tailored to your business needs.
Format: PDF and Word document
Quantity: One complete report
Revisions: Up to two rounds of revisions included
Interactive Dashboard
Description: A user-friendly, interactive dashboard created using tools like Tableau or Power BI, allowing you to visualize key metrics and track performance in real time.
Format: Web-based dashboard link and PDF summary
Quantity: One dashboard
Revisions: One round of revisions for layout and functionality
Presentation of Findings
Description: A professional presentation summarizing the key insights and recommendations from the analysis, designed for sharing with stakeholders and decision-makers.
Format: PowerPoint presentation
Quantity: One presentation (up to 8-10 slides)
Revisions: One round of revisions for content and design
$50 /hr