
AI-Powered Data Dashboard in 2 WeeksZoha Ahmed
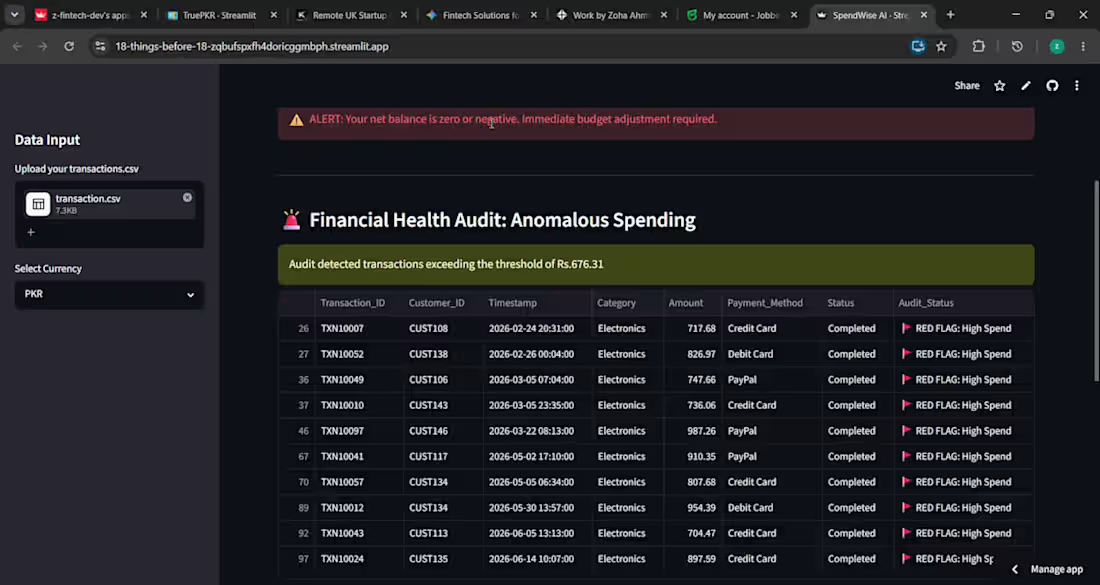
You have a spreadsheet, an export, or a database table, and every time someone asks a question about it you spend an afternoon answering. This turns that data into a dashboard that answers the question itself.
What you get
An interactive dashboard that ingests your data, computes the metrics that matter, and surfaces the things you'd otherwise have to go looking for — outliers, trends, thresholds crossed. Built in Python with Streamlit, or as a React front end if you need it embedded in something you already have.
Who this is for
Small teams and founders drowning in a spreadsheet they can't see clearly. Operations, sales, spend, usage — if the data exists and the insight doesn't, this closes that gap.
How I work
You send the data. Real data, messy, however it comes out of the source system. I'd rather see the mess than a cleaned sample, because the mess is what the pipeline has to survive.
We agree the questions. Three to five things the dashboard must answer. This keeps it a tool rather than a wall of charts.
Build and iterate. You see it working early and tell me what's missing while it's still cheap to change.
Deploy and hand over. Live, with the code.
On the AI part
I use analysis and language models where they earn their place — summarising, classifying, drafting explanations of what the numbers mean. I don't use them for the arithmetic. Anything that produces a number you'd make a decision on gets computed deterministically, so you can check it. That distinction matters more than it sounds like it does.
FAQs
Zoha's other services

Starting at$800
Duration2 weeks
Tags
Dashboard Design
Python

Streamlit

AI
Data Analyst
Data Visualizer
Service provided by
Zoha Ahmed Karachi, Pakistan
- 1
- Followers
AI-Powered Data Dashboard in 2 WeeksZoha Ahmed
Starting at$800
Duration2 weeks
Tags
Dashboard Design
Python
Streamlit
AI
Data Analyst
Data Visualizer
You have a spreadsheet, an export, or a database table, and every time someone asks a question about it you spend an afternoon answering. This turns that data into a dashboard that answers the question itself.
What you get
An interactive dashboard that ingests your data, computes the metrics that matter, and surfaces the things you'd otherwise have to go looking for — outliers, trends, thresholds crossed. Built in Python with Streamlit, or as a React front end if you need it embedded in something you already have.
Who this is for
Small teams and founders drowning in a spreadsheet they can't see clearly. Operations, sales, spend, usage — if the data exists and the insight doesn't, this closes that gap.
How I work
You send the data. Real data, messy, however it comes out of the source system. I'd rather see the mess than a cleaned sample, because the mess is what the pipeline has to survive.
We agree the questions. Three to five things the dashboard must answer. This keeps it a tool rather than a wall of charts.
Build and iterate. You see it working early and tell me what's missing while it's still cheap to change.
Deploy and hand over. Live, with the code.
On the AI part
I use analysis and language models where they earn their place — summarising, classifying, drafting explanations of what the numbers mean. I don't use them for the arithmetic. Anything that produces a number you'd make a decision on gets computed deterministically, so you can check it. That distinction matters more than it sounds like it does.
FAQs
Zoha's other services
$800