
Data Analysis and Visualization with Microsoft ExcelIman Adeko
Using Microsoft excel, I'll take your messy data and turn it into easy-to-understand charts and graphs. I'll explain the results clearly, so you can make better decisions.
What's included
Clean and organized data
A well-structured dataset, free of errors and inconsistencies.
Data Analysis Report
A comprehensive report detailing the analysis process, key findings, and insights.
Data Visualizations
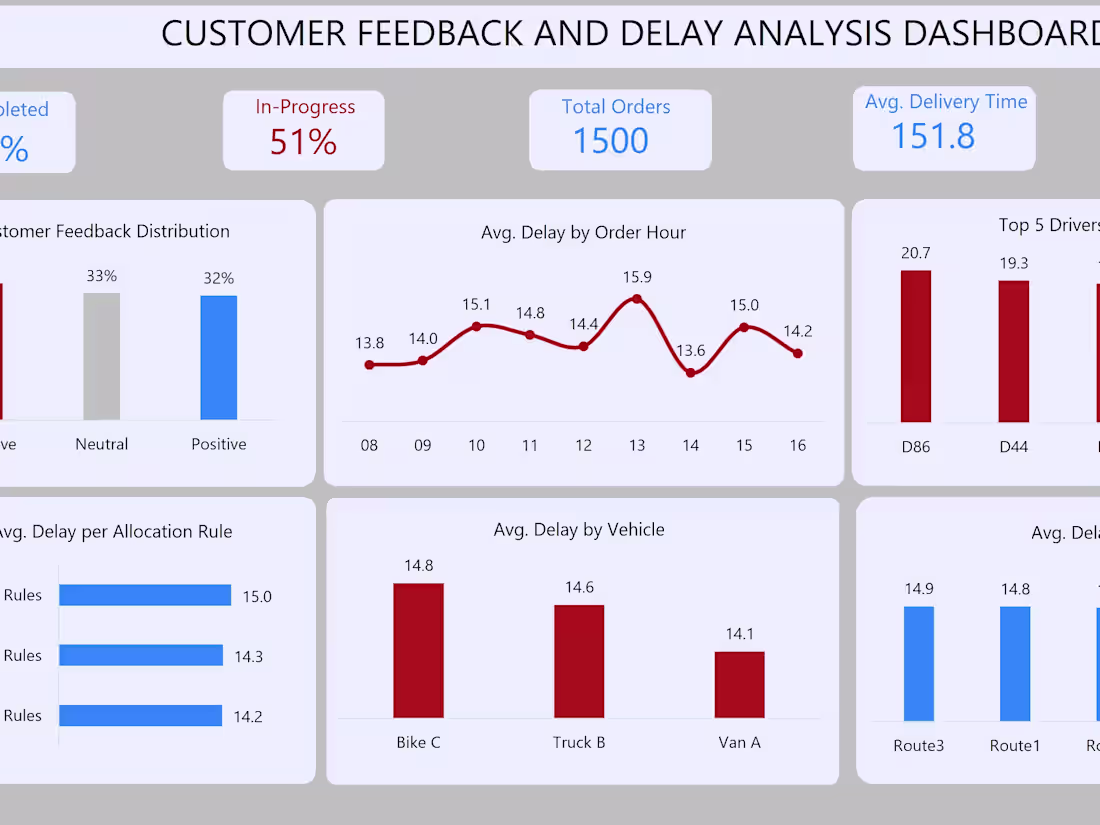
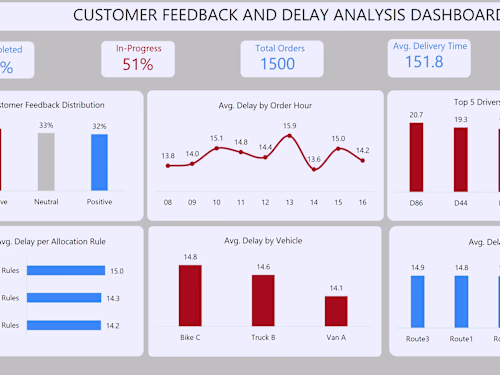
Customized charts, graphs, and dashboards to visually represent data and trends.
Excel Workbook
The original Excel workbook with formulas, calculations, and visualizations, allowing for further exploration and customization.
Example work
Contact for pricing
Tags
Microsoft Excel
Microsoft Power BI
Data Analyst
Data Scientist
Data Visualizer
Service provided by
Iman Adeko Lagos, Nigeria
Data Analysis and Visualization with Microsoft ExcelIman Adeko
Contact for pricing
Tags
Microsoft Excel
Microsoft Power BI
Data Analyst
Data Scientist
Data Visualizer
Using Microsoft excel, I'll take your messy data and turn it into easy-to-understand charts and graphs. I'll explain the results clearly, so you can make better decisions.
What's included
Clean and organized data
A well-structured dataset, free of errors and inconsistencies.
Data Analysis Report
A comprehensive report detailing the analysis process, key findings, and insights.
Data Visualizations
Customized charts, graphs, and dashboards to visually represent data and trends.
Excel Workbook
The original Excel workbook with formulas, calculations, and visualizations, allowing for further exploration and customization.
Example work
Contact for pricing