
Dashboard and Data Visualisation DesignRod Acevedo
Raw model output isn't a product. I design dashboards and data visualisations that turn AI and analytics output into interfaces people can actually act on.
I designed visualisation frameworks for a computer vision platform processing 10 million daily detections, so I know how to make dense data legible without dumbing it down.
What's included
Data and decision audit: what users need to decide, not just what data exists.
Information hierarchy: the one-glance layer, the dig-deeper layer.
Visualisation design: the right chart for the job, every time.
Dashboard UI in Figma, including loading, empty and error states.
Developer handoff with behaviour specs.
Perfect for
Product teams whose dashboards have become data graveyards, and AI companies whose model output needs a human-readable front end.
Deliverables
Complete dashboard designs in Figma
Visualisation specification and component patterns
Interaction and state documentation
Dev handoff session
Timeline
Timeframe
2 to 5 weeks.
Typical investment
$2,500 to $7,000.
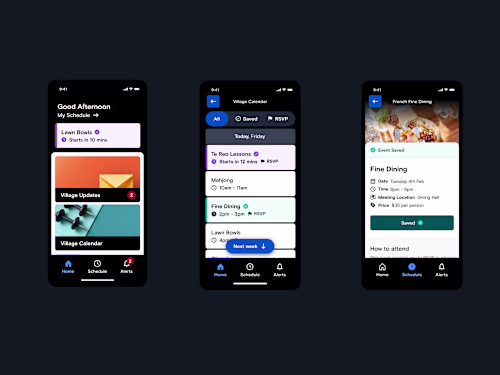
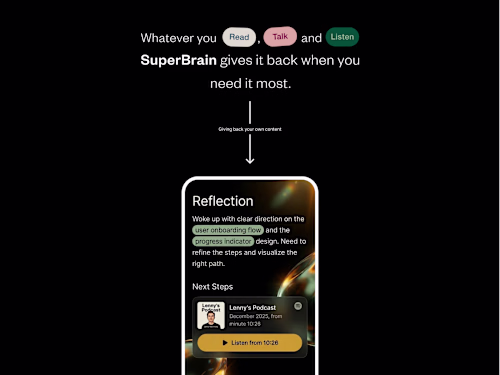
Example work


Starting at$2,500
Duration2 weeks
Tags
Claude
Figma
AI Developer
Data Visualizer
Product Designer
UI Designer
UX Designer
Analytics
Data
Service provided by
Rod Acevedo proSydney NSW 2000, Australia
- 5.00
- Rating
- 9
- Followers
Dashboard and Data Visualisation DesignRod Acevedo
Starting at$2,500
Duration2 weeks
Tags
Claude
Figma
AI Developer
Data Visualizer
Product Designer
UI Designer
UX Designer
Analytics
Data
Raw model output isn't a product. I design dashboards and data visualisations that turn AI and analytics output into interfaces people can actually act on.
I designed visualisation frameworks for a computer vision platform processing 10 million daily detections, so I know how to make dense data legible without dumbing it down.
What's included
Data and decision audit: what users need to decide, not just what data exists.
Information hierarchy: the one-glance layer, the dig-deeper layer.
Visualisation design: the right chart for the job, every time.
Dashboard UI in Figma, including loading, empty and error states.
Developer handoff with behaviour specs.
Perfect for
Product teams whose dashboards have become data graveyards, and AI companies whose model output needs a human-readable front end.
Deliverables
Complete dashboard designs in Figma
Visualisation specification and component patterns
Interaction and state documentation
Dev handoff session
Timeline
Timeframe
2 to 5 weeks.
Typical investment
$2,500 to $7,000.
Example work
$2,500