
Data Visualization with Power BIMichael Tawk
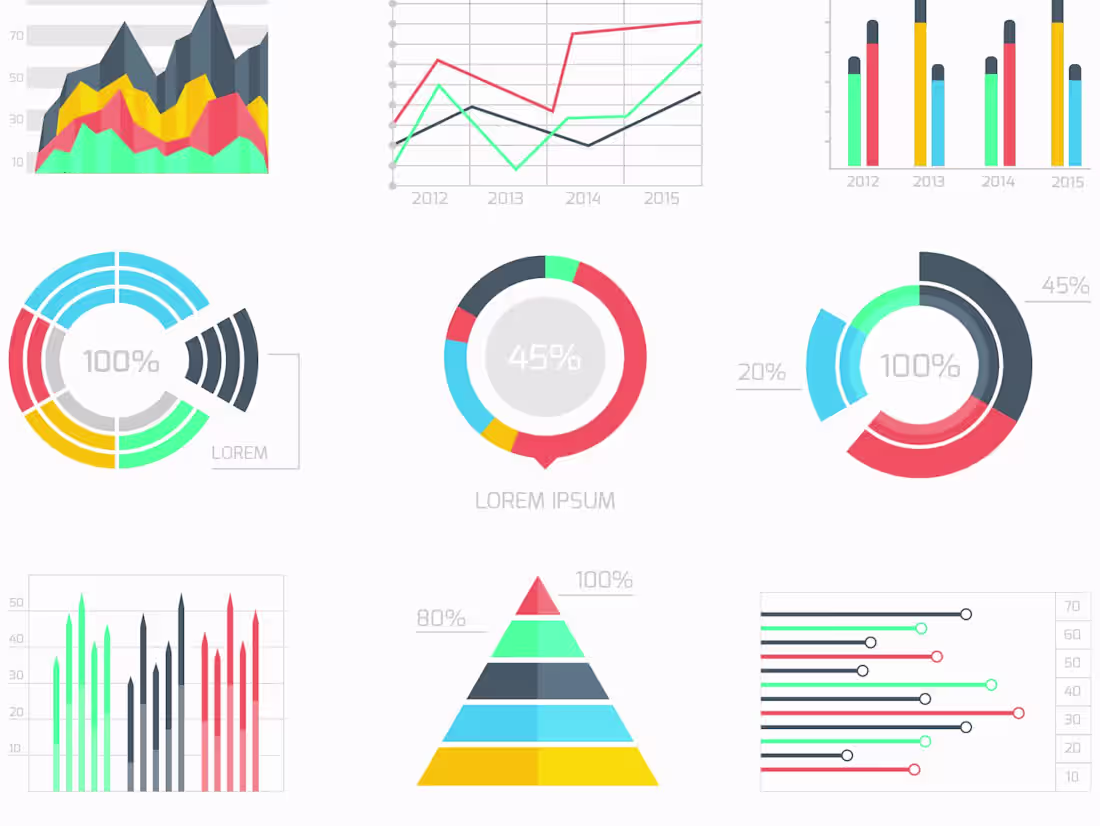
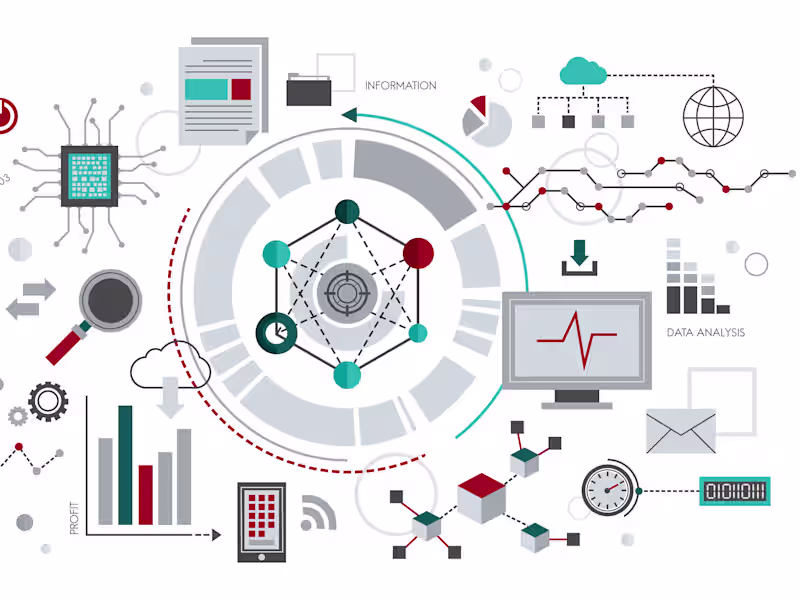
I offer expert services in creating PowerBI dashboards and visualizations that turn complex data into clear, actionable insights. What sets me apart is my ability to tailor reports and dashboards to your specific needs, integrating multiple data sources seamlessly for a comprehensive view that drives better decision-making and trend analysis.
What's included
Data Visualization
Designing straightforward and engaging visual representations that convert complex data into easy-to-understand and actionable insights.
Data Integration
Effortlessly combining multiple data sources into PowerBI to provide a cohesive view of your data for thorough analysis and reporting.
Interactive Dashboards/Reports
Custom PowerBI dashboards or reports that deliver insightful and up-to-date data visualizations, enhancing decision-making and trend analysis.
Michael's other services

Contact for pricing
Tags
Excel VBA
Microsoft Excel
Microsoft Power BI
Python
Data Analyst
Data Scientist
Data Visualizer
Service provided by
Michael Tawk Lebanon
Data Visualization with Power BIMichael Tawk
Contact for pricing
Tags
Excel VBA
Microsoft Excel
Microsoft Power BI
Python
Data Analyst
Data Scientist
Data Visualizer
I offer expert services in creating PowerBI dashboards and visualizations that turn complex data into clear, actionable insights. What sets me apart is my ability to tailor reports and dashboards to your specific needs, integrating multiple data sources seamlessly for a comprehensive view that drives better decision-making and trend analysis.
What's included
Data Visualization
Designing straightforward and engaging visual representations that convert complex data into easy-to-understand and actionable insights.
Data Integration
Effortlessly combining multiple data sources into PowerBI to provide a cohesive view of your data for thorough analysis and reporting.
Interactive Dashboards/Reports
Custom PowerBI dashboards or reports that deliver insightful and up-to-date data visualizations, enhancing decision-making and trend analysis.
Michael's other services
Contact for pricing