
Excel Dashboard & Data Analysis for Business Insightschandana A
I will create a professional and interactive Excel dashboard to help you understand and analyze your data effectively.
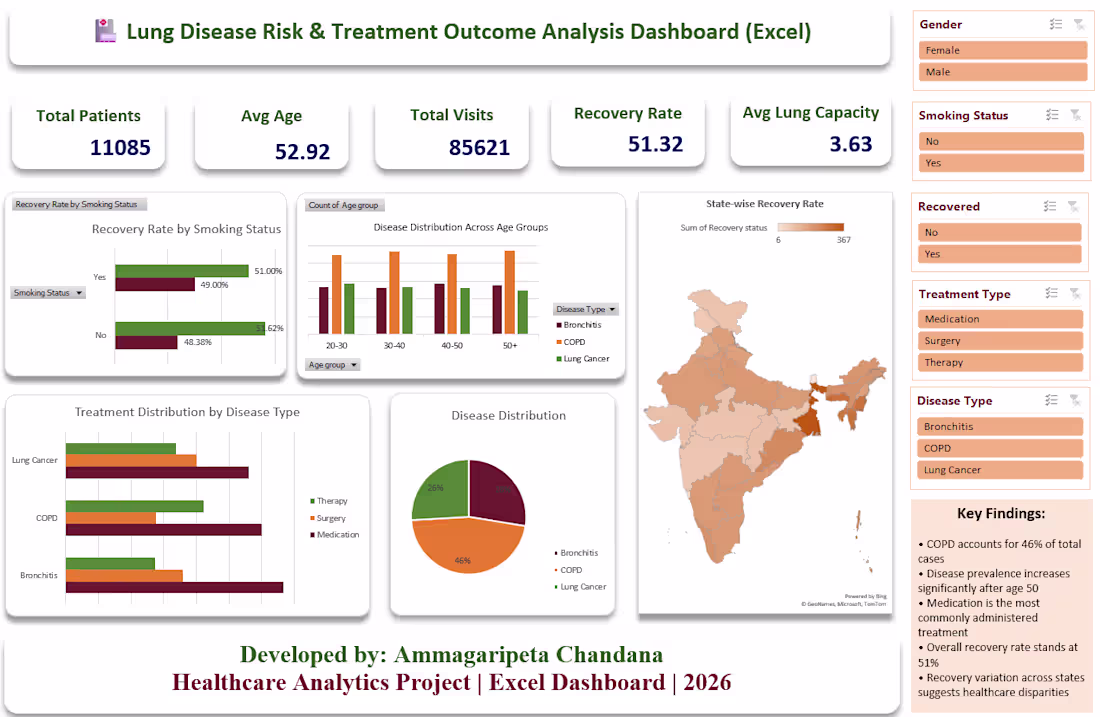
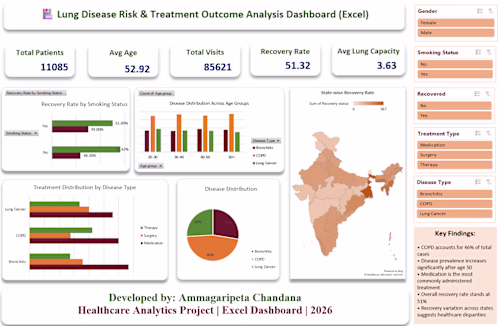
Using Microsoft Excel, I transform raw datasets into clear insights using charts, KPIs, Pivot Tables, and interactive filters. My dashboards are designed to make complex data easy to understand and support better business decisions.
This service is ideal for sales analysis, business performance tracking, reporting, and data visualization.
What you will get:
• Interactive Excel dashboard
• Data cleaning and preparation
• KPI metrics and charts
• Pivot table analysis
• Clear and organized data visualization
Tools Used: Microsoft Excel, Pivot Tables, Charts, Data Visualization
Why Choose Me
• Strong knowledge of Excel data analysis and dashboard design
• Clean, clear, and easy-to-understand visualizations
• Focus on turning raw data into meaningful business insights
• Attention to detail and organized reporting
• Friendly communication and timely delivery
FAQs
Example work
Starting at$25
Duration3 days
Tags
Microsoft Excel
Business Intelligence
Data Analyst
Data Visualizer
Reporting
Dashboard Design
Data Cleaning
Excel Dashboard
Pivot Tables
Service provided by
chandana A Hyderabad, India
Excel Dashboard & Data Analysis for Business Insightschandana A
Starting at$25
Duration3 days
Tags
Microsoft Excel
Business Intelligence
Data Analyst
Data Visualizer
Reporting
Dashboard Design
Data Cleaning
Excel Dashboard
Pivot Tables
I will create a professional and interactive Excel dashboard to help you understand and analyze your data effectively.
Using Microsoft Excel, I transform raw datasets into clear insights using charts, KPIs, Pivot Tables, and interactive filters. My dashboards are designed to make complex data easy to understand and support better business decisions.
This service is ideal for sales analysis, business performance tracking, reporting, and data visualization.
What you will get:
• Interactive Excel dashboard
• Data cleaning and preparation
• KPI metrics and charts
• Pivot table analysis
• Clear and organized data visualization
Tools Used: Microsoft Excel, Pivot Tables, Charts, Data Visualization
Why Choose Me
• Strong knowledge of Excel data analysis and dashboard design
• Clean, clear, and easy-to-understand visualizations
• Focus on turning raw data into meaningful business insights
• Attention to detail and organized reporting
• Friendly communication and timely delivery
FAQs
Example work
$25