
Tableau Dashboards and reportsIrfan Sajjad
Specializes in creating visually appealing and interactive dashboards that effectively communicate complex information.
Using industry-leading tools like Tableau , transforms raw data into meaningful visualizations that enable clients to interpret trends, patterns, and correlations at a glance.
By presenting data in an intuitive way, ensures that clients can easily comprehend information for better decision-making.
What's included
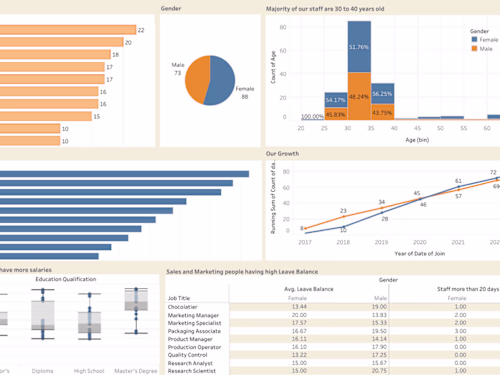
Interactive Dashboard
Interactive dashboard with an intuitive interface for exploring and analyzing your data.
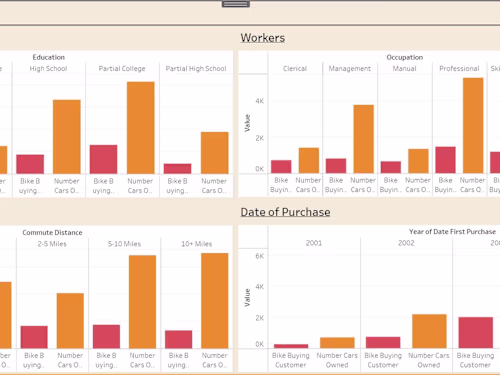
Visualizations
Bar charts, line graphs, scatter plots, heat maps, gauge charts, histograms and pie charts.
Dashboard Documentation
Documentation include descriptions of each visualization, explanations of filters and parameters, and instructions for interacting with the dashboard.
Tableau Workbook
The Tableau workbook (.twbx or .twb file) containing all the visualizations and dashboards.
Irfan's other services

Starting at$25
Duration2 days
Tags
Microsoft Excel
Microsoft Power BI
MySQL
SQL
Tableau
Data Analyst
Data Scientist
Data Visualizer
Service provided by
Irfan Sajjad Pakistan
- 27
- Followers
Tableau Dashboards and reportsIrfan Sajjad
Starting at$25
Duration2 days
Tags
Microsoft Excel
Microsoft Power BI
MySQL
SQL
Tableau
Data Analyst
Data Scientist
Data Visualizer
Specializes in creating visually appealing and interactive dashboards that effectively communicate complex information.
Using industry-leading tools like Tableau , transforms raw data into meaningful visualizations that enable clients to interpret trends, patterns, and correlations at a glance.
By presenting data in an intuitive way, ensures that clients can easily comprehend information for better decision-making.
What's included
Interactive Dashboard
Interactive dashboard with an intuitive interface for exploring and analyzing your data.
Visualizations
Bar charts, line graphs, scatter plots, heat maps, gauge charts, histograms and pie charts.
Dashboard Documentation
Documentation include descriptions of each visualization, explanations of filters and parameters, and instructions for interacting with the dashboard.
Tableau Workbook
The Tableau workbook (.twbx or .twb file) containing all the visualizations and dashboards.
Irfan's other services
$25