
Business KPI Dashboards & Growth ReportingMuhammad Awais
Hire an automation expert to turn scattered spreadsheets, CRMs and ad platforms into a single KPI dashboard that updates itself and tells you what changed — in plain language, every morning. Most reporting pipelines go live within 48 hours, never more than 1 week.
What you get from this KPI reporting service
One source of truth pulling revenue, pipeline, churn and campaign data into a live dashboard your team trusts
AI-written summaries that explain the movement — what went up, what caused it and what to watch next
Scheduled digests to Slack, email or Google Sheets on the cadence you choose, never late, never manual
Alerts on the numbers that matter — a sudden drop in signups or a spend spike reaches you the same day
Stack I build with
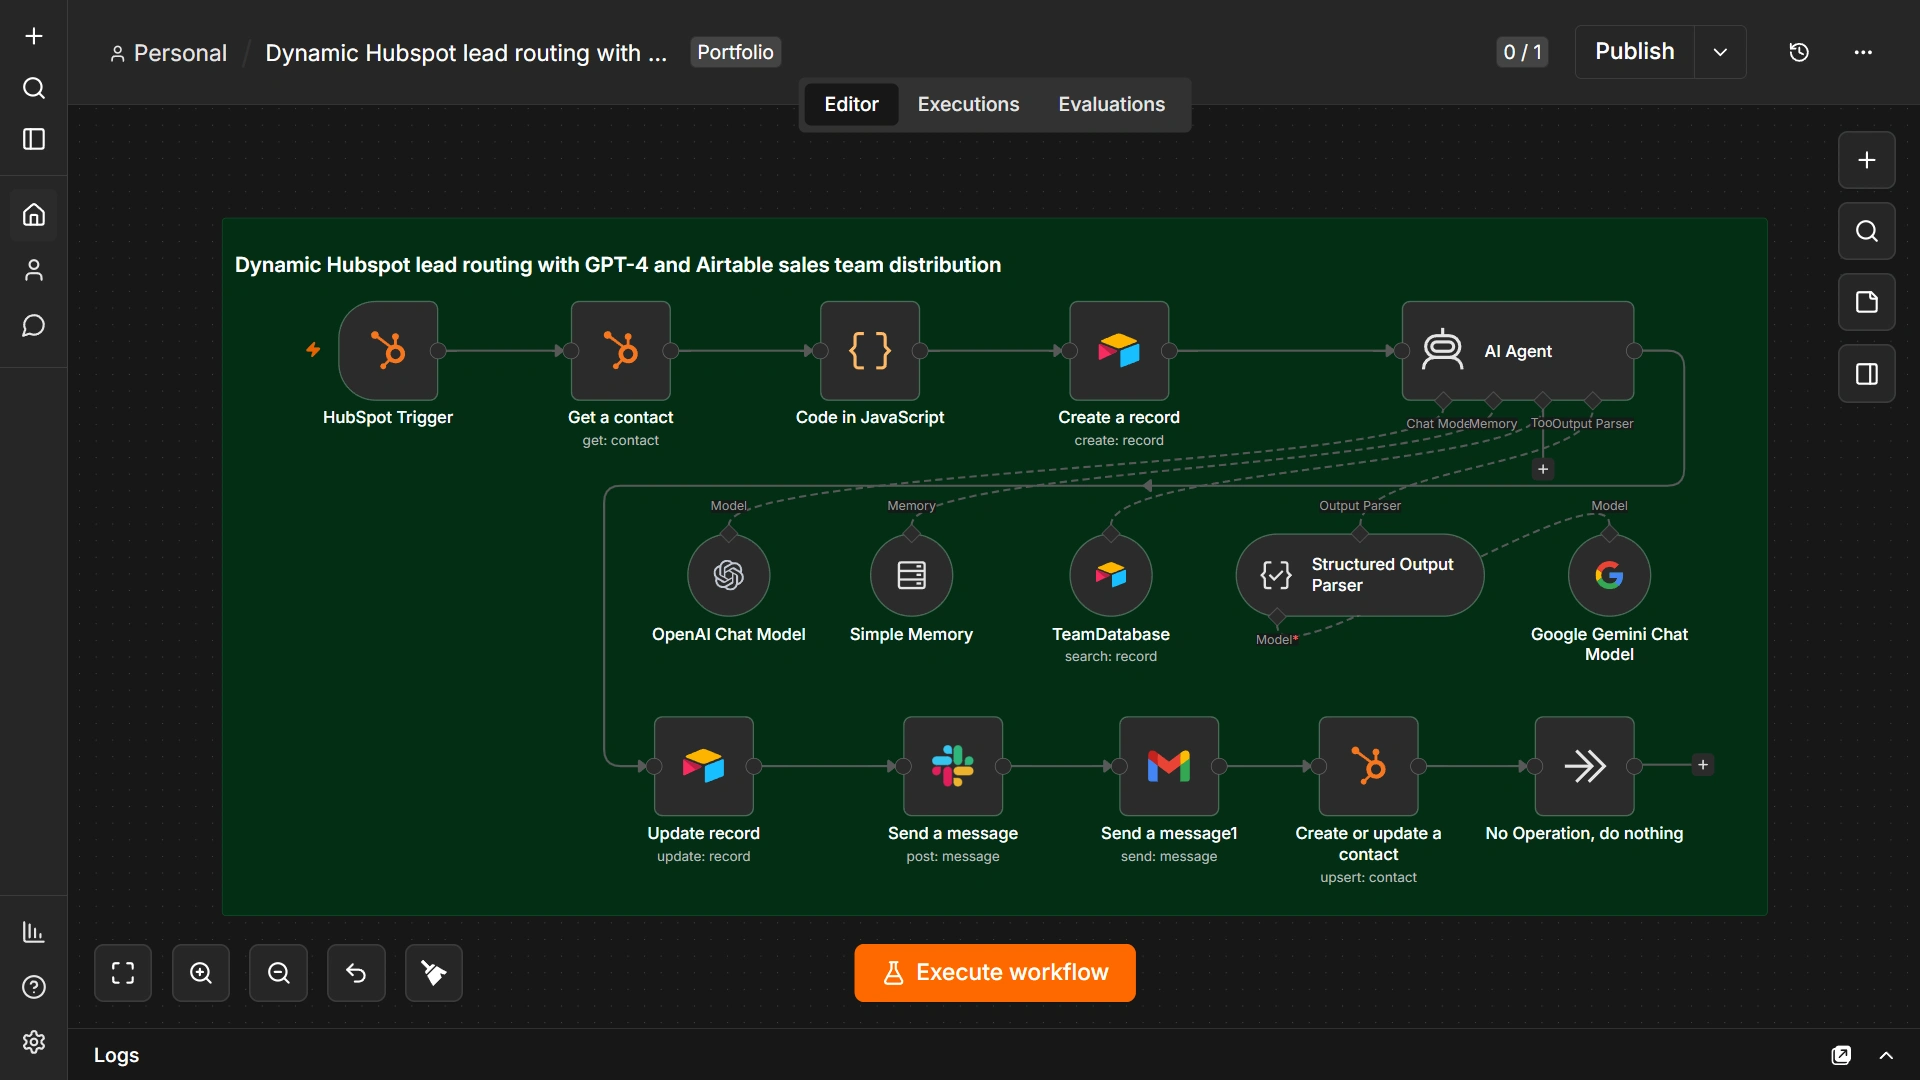
n8n, Make.com, Google Sheets, Looker Studio, Airtable and Slack, with OpenAI for the narrative layer. Connects to Stripe, HubSpot, Google Ads, Meta Ads, GA4, Shopify and any database or API you run.
Proven results from real reporting projects
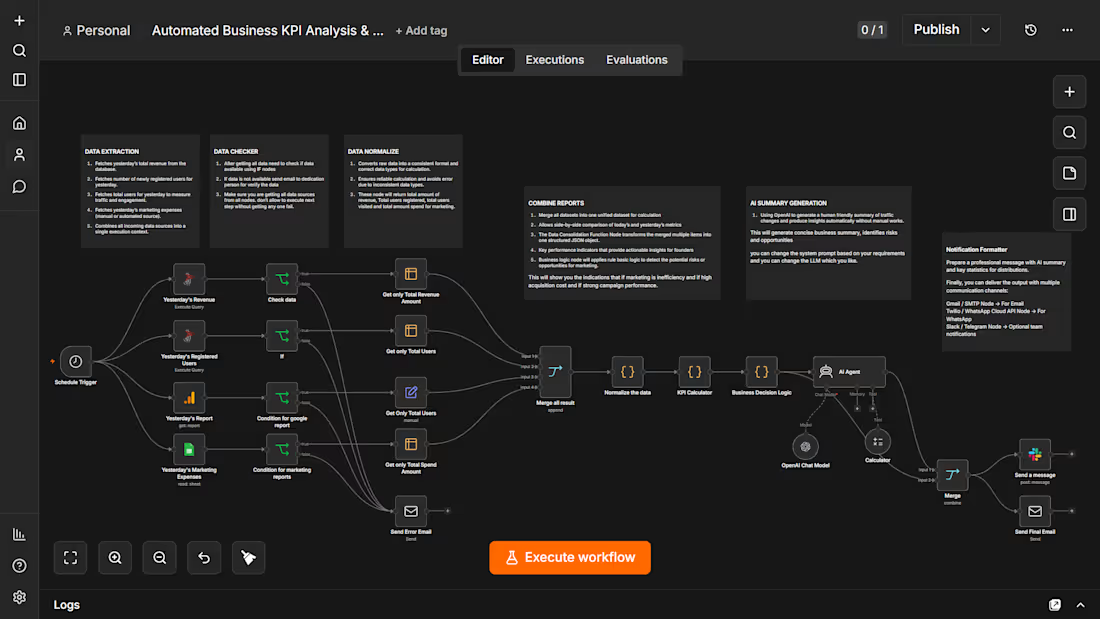
Automated business KPI analysis: growth insights without the manual spreadsheet ritual
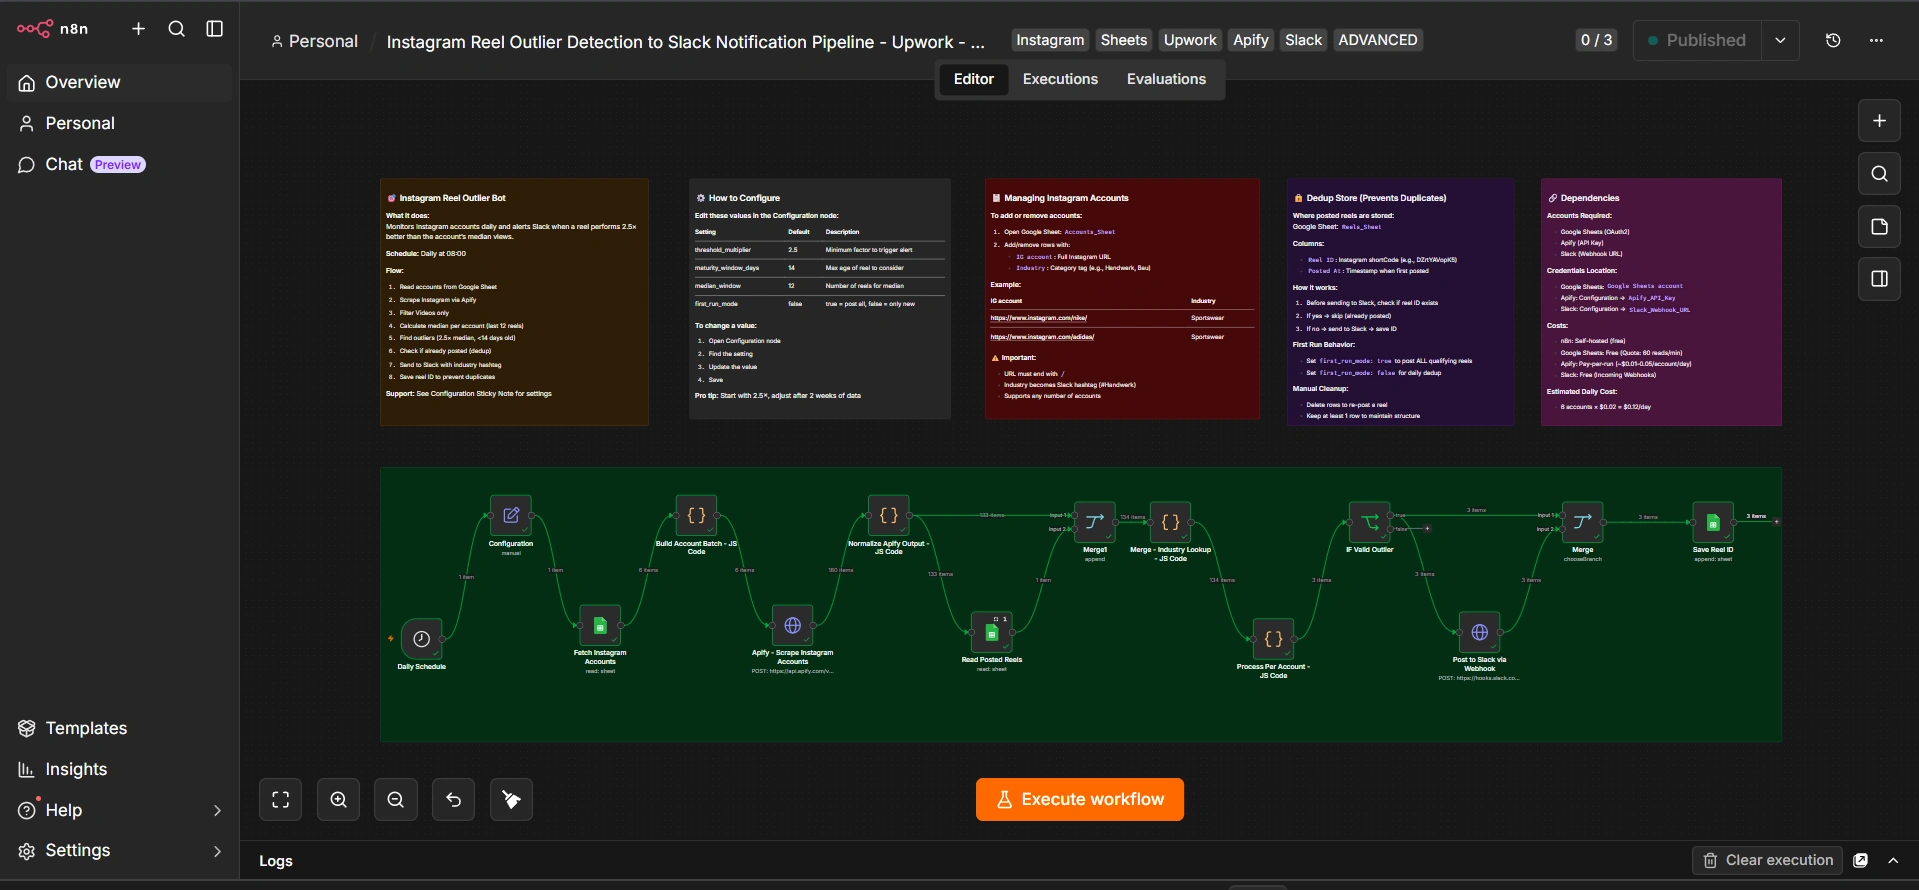
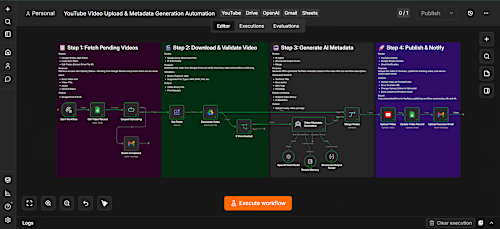
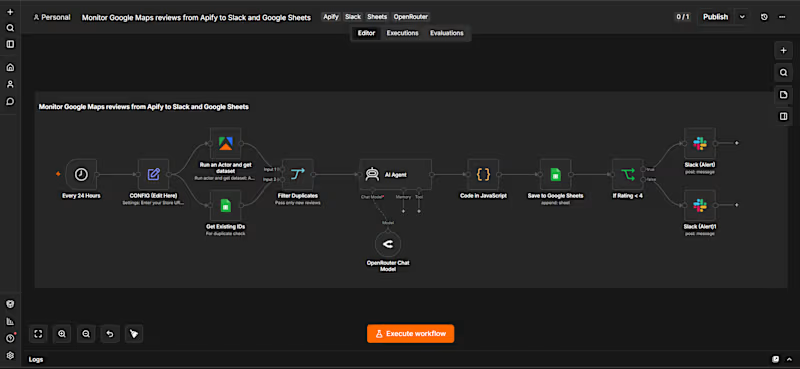
Automated Slack reporting pipeline with Apify: 10+ hrs/week saved, replaced 10+ hrs/day of manual collection
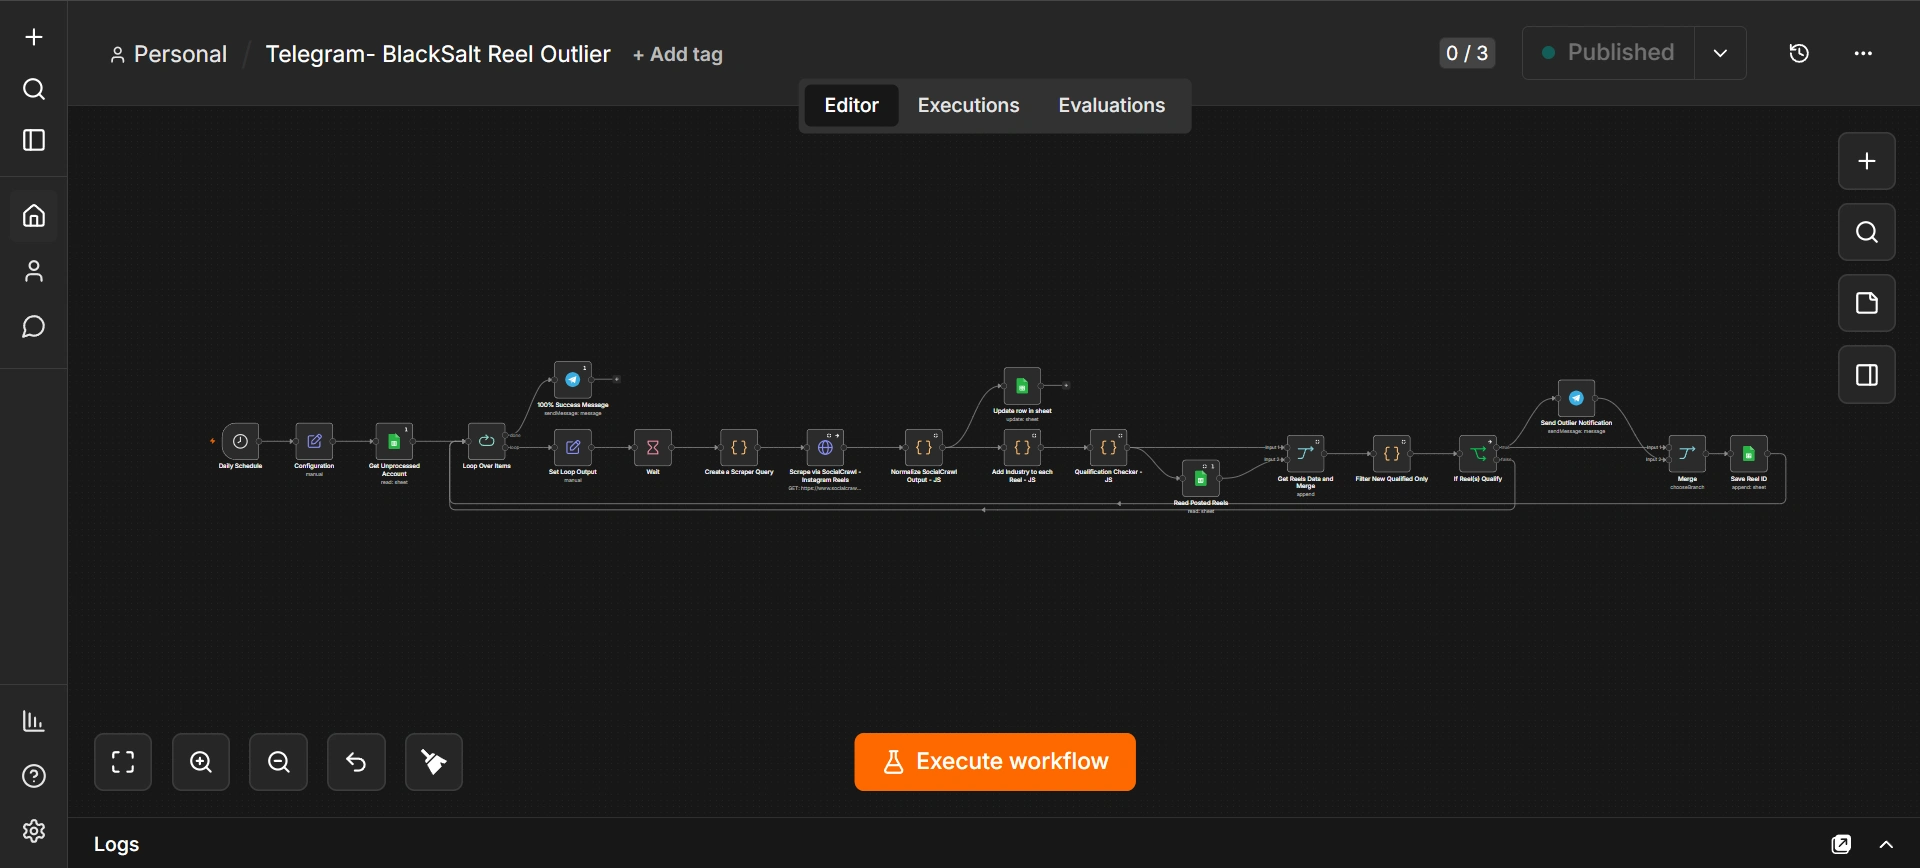
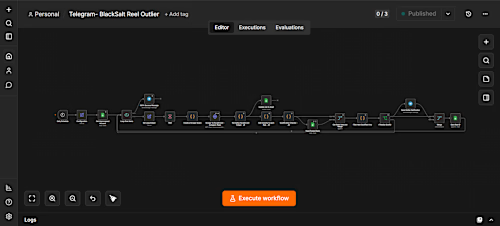
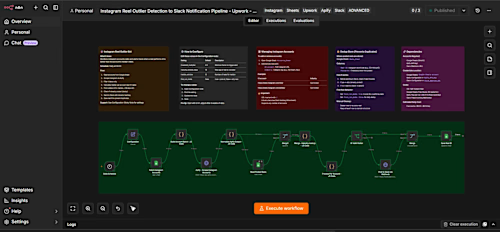
Instagram reels outlier detection to Telegram: monitors 50+ accounts at 100% detection rate
Delivery & turnaround
A single-source dashboard usually ships within 48 hours. Multi-source builds with AI commentary never take more than 1 week. Ready for all types of projects — one-off builds or ongoing retainers.
Tell me the three numbers you check every morning, and I'll have them waiting for you.
FAQs
Example work
Contact for pricing
Duration1 week
Tags
Airtable

Google Sheets

Looker Studio

OpenAI

Slack

AI Automation
Data Visualizer
Business Analytics
n8n
Service provided by
Muhammad Awais Islamabad, Pakistan
- 2
- Followers
Business KPI Dashboards & Growth ReportingMuhammad Awais
Contact for pricing
Duration1 week
Tags
Airtable
Google Sheets
Looker Studio
OpenAI
Slack
AI Automation
Data Visualizer
Business Analytics
n8n
Hire an automation expert to turn scattered spreadsheets, CRMs and ad platforms into a single KPI dashboard that updates itself and tells you what changed — in plain language, every morning. Most reporting pipelines go live within 48 hours, never more than 1 week.
What you get from this KPI reporting service
One source of truth pulling revenue, pipeline, churn and campaign data into a live dashboard your team trusts
AI-written summaries that explain the movement — what went up, what caused it and what to watch next
Scheduled digests to Slack, email or Google Sheets on the cadence you choose, never late, never manual
Alerts on the numbers that matter — a sudden drop in signups or a spend spike reaches you the same day
Stack I build with
n8n, Make.com, Google Sheets, Looker Studio, Airtable and Slack, with OpenAI for the narrative layer. Connects to Stripe, HubSpot, Google Ads, Meta Ads, GA4, Shopify and any database or API you run.
Proven results from real reporting projects
Automated business KPI analysis: growth insights without the manual spreadsheet ritual
Automated Slack reporting pipeline with Apify: 10+ hrs/week saved, replaced 10+ hrs/day of manual collection
Instagram reels outlier detection to Telegram: monitors 50+ accounts at 100% detection rate
Delivery & turnaround
A single-source dashboard usually ships within 48 hours. Multi-source builds with AI commentary never take more than 1 week. Ready for all types of projects — one-off builds or ongoing retainers.
Tell me the three numbers you check every morning, and I'll have them waiting for you.
FAQs
Example work
Contact for pricing