
Data Strategy: From Automation to Revenue Growthkaze nesia
Turn your raw data into a growth engine. I integrate automated data systems, analyze customer behavior in depth, and present it in a ready-to-use dashboard for strategic decision making.
Highlight Service:
Engineering: Automated Sentiment Analysis and routine Data Cleaning.
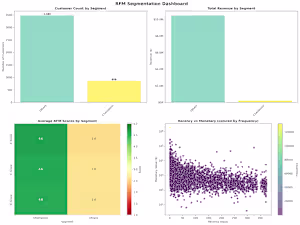
Analytics: Customer Intelligence (RFM Segmentation & Churn Prediction) to improve retention.
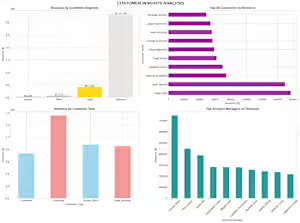
Actionable Insights: Market Basket Analysis for cross-selling and product bundling strategies.
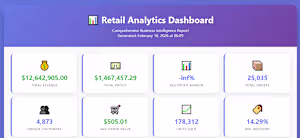
Visualization: Interactive Google Dashboard for daily performance monitoring.
FAQs
It covers the entire lifecycle of your data. I handle the Engineering (cleaning and automating your data flows), the Analysis (running models like RFM, Churn Prediction, and Market Basket Analysis), and the Visualization (creating intuitive Google Dashboards) so you have a single source of truth for your business.
Absolutely. Data Cleaning and Automation are core parts of my service. I can automate the extraction and cleaning process (including Sentiment Analysis Automation for customer feedback) to ensure the insights you see on your dashboard are always accurate and up-to-date.
I use advanced techniques like RFM Segmentation to identify your most loyal customers and Market Basket Analysis to discover which products are frequently bought together. This allows you to run highly targeted marketing campaigns and optimized product bundles that directly impact your ROI.
es. Using Predictive Sales Forecasting, I can help you anticipate demand for better inventory management. I also specialize in Customer Churn Prediction, which identifies "at-risk" customers before they leave, giving you the chance to retain them proactively.
My primary stack includes Python and SQL for heavy lifting and automation, and Google Looker Studio (Google Dashboard) or Tableau for visualization. However, I am flexible and can work with your existing tech stack depending on your needs.
ou get both! While I provide Data Storytelling reports for deep-dive insights and executive summaries, I primarily build Live Interactive Dashboards. This means your data refreshes automatically, allowing you to monitor your KPIs in real-time.
We’ll start with a brief discovery call to discuss your current data setup and your business goals. From there, I will propose a roadmap—starting from data integration to the final delivery of your strategic insights.

Contact for pricing
Duration1 week
Tags
Data Analyst
Data Engineer
Data Visualizer
Service provided by
kaze nesia Surabaya, Indonesia
- 1
- Followers
Data Strategy: From Automation to Revenue Growthkaze nesia
Contact for pricing
Duration1 week
Tags
Data Analyst
Data Engineer
Data Visualizer
Turn your raw data into a growth engine. I integrate automated data systems, analyze customer behavior in depth, and present it in a ready-to-use dashboard for strategic decision making.
Highlight Service:
Engineering: Automated Sentiment Analysis and routine Data Cleaning.
Analytics: Customer Intelligence (RFM Segmentation & Churn Prediction) to improve retention.
Actionable Insights: Market Basket Analysis for cross-selling and product bundling strategies.
Visualization: Interactive Google Dashboard for daily performance monitoring.
FAQs
It covers the entire lifecycle of your data. I handle the Engineering (cleaning and automating your data flows), the Analysis (running models like RFM, Churn Prediction, and Market Basket Analysis), and the Visualization (creating intuitive Google Dashboards) so you have a single source of truth for your business.
Absolutely. Data Cleaning and Automation are core parts of my service. I can automate the extraction and cleaning process (including Sentiment Analysis Automation for customer feedback) to ensure the insights you see on your dashboard are always accurate and up-to-date.
I use advanced techniques like RFM Segmentation to identify your most loyal customers and Market Basket Analysis to discover which products are frequently bought together. This allows you to run highly targeted marketing campaigns and optimized product bundles that directly impact your ROI.
es. Using Predictive Sales Forecasting, I can help you anticipate demand for better inventory management. I also specialize in Customer Churn Prediction, which identifies "at-risk" customers before they leave, giving you the chance to retain them proactively.
My primary stack includes Python and SQL for heavy lifting and automation, and Google Looker Studio (Google Dashboard) or Tableau for visualization. However, I am flexible and can work with your existing tech stack depending on your needs.
ou get both! While I provide Data Storytelling reports for deep-dive insights and executive summaries, I primarily build Live Interactive Dashboards. This means your data refreshes automatically, allowing you to monitor your KPIs in real-time.
We’ll start with a brief discovery call to discuss your current data setup and your business goals. From there, I will propose a roadmap—starting from data integration to the final delivery of your strategic insights.
Contact for pricing