
Business Analytics Dashboard & Automated ReportingNisa Tek
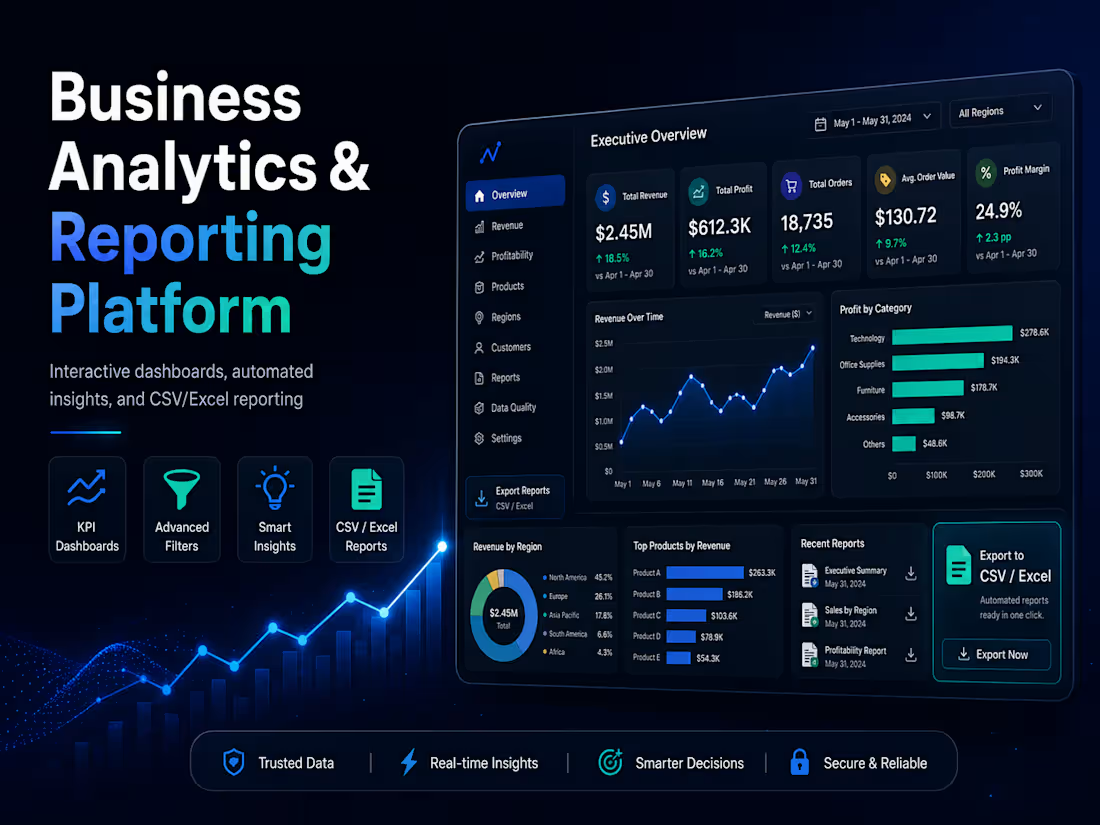
Transform your raw business data into a custom analytics dashboard that makes performance easier to track, understand, and act on.
I build custom business analytics dashboards that help you monitor key KPIs, understand revenue and profitability, compare product and regional performance, and turn complex datasets into actionable insights.
Your dashboard can include:
• Data cleaning and preparation
• Revenue, profit, order, AOV, and margin KPIs
• Interactive filters for dates, regions, categories, and customer segments
• Sales and profitability trend analysis
• Product, category, and regional performance breakdowns
• Automated business insights based on your data
• Data quality checks for missing, duplicate, or invalid records
• Downloadable CSV and multi-sheet Excel reports
• Deployment as an interactive Streamlit web application
I build each solution around the structure of your data and the metrics that matter to your business, rather than using a generic one-size-fits-all dashboard.
Tech stack: Python, Pandas, Streamlit, Plotly, OpenPyXL
You’ll receive a practical analytics solution designed to make your data easier to explore, understand, and report.
Example Work
Live Demo: https://business-analytics-platform.streamlit.app/
GitHub: https://github.com/niisa0/business-analytics-platform
FAQs
Example work
Starting at$75
Duration3 days
Tags
pandas

Plotly
Python

Streamlit

Data
Service provided by
Nisa Tek Antalya, Turkey
- 3
- Followers
Business Analytics Dashboard & Automated ReportingNisa Tek
Starting at$75
Duration3 days
Tags
pandas
Plotly
Python
Streamlit
Data
Transform your raw business data into a custom analytics dashboard that makes performance easier to track, understand, and act on.
I build custom business analytics dashboards that help you monitor key KPIs, understand revenue and profitability, compare product and regional performance, and turn complex datasets into actionable insights.
Your dashboard can include:
• Data cleaning and preparation
• Revenue, profit, order, AOV, and margin KPIs
• Interactive filters for dates, regions, categories, and customer segments
• Sales and profitability trend analysis
• Product, category, and regional performance breakdowns
• Automated business insights based on your data
• Data quality checks for missing, duplicate, or invalid records
• Downloadable CSV and multi-sheet Excel reports
• Deployment as an interactive Streamlit web application
I build each solution around the structure of your data and the metrics that matter to your business, rather than using a generic one-size-fits-all dashboard.
Tech stack: Python, Pandas, Streamlit, Plotly, OpenPyXL
You’ll receive a practical analytics solution designed to make your data easier to explore, understand, and report.
Example Work
Live Demo: https://business-analytics-platform.streamlit.app/
GitHub: https://github.com/niisa0/business-analytics-platform
FAQs
Example work
$75