
Interactive Customer Churn & Retention DashboardNisa Tek
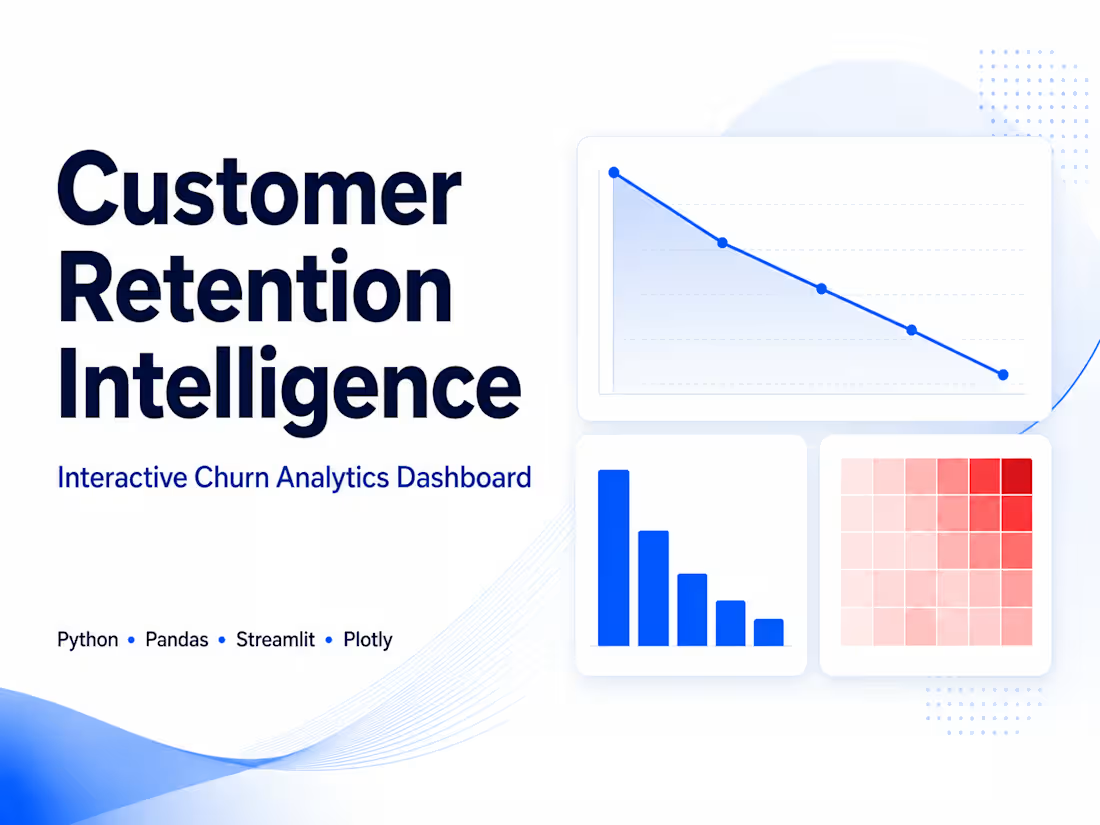
Turn your customer data into a clear, interactive retention analytics dashboard that helps identify churn patterns, high-risk customer segments, and areas that deserve attention.
I build custom customer churn and retention dashboards using Python, Pandas, Streamlit, and Plotly. Your raw CSV or Excel data will be cleaned, validated, analyzed, and transformed into an interactive dashboard designed for practical business use.
Depending on your dataset and requirements, the dashboard can include:
• Customer churn and retention KPIs
• High-risk customer segment analysis
• Contract and customer tenure analysis
• Interactive filters and visualizations
• Churn driver and reported reason analysis
• Customer segment comparisons
• Financial exposure and revenue-related metrics
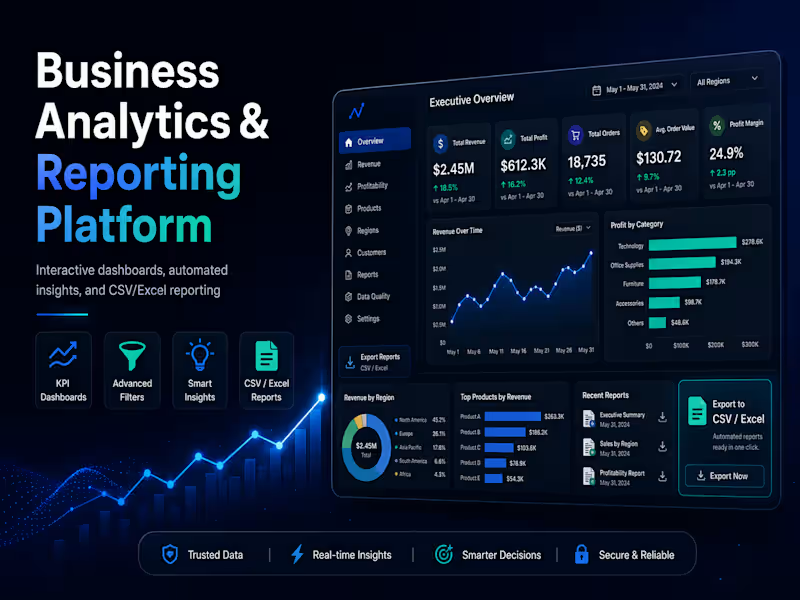
• Downloadable CSV and Excel reports
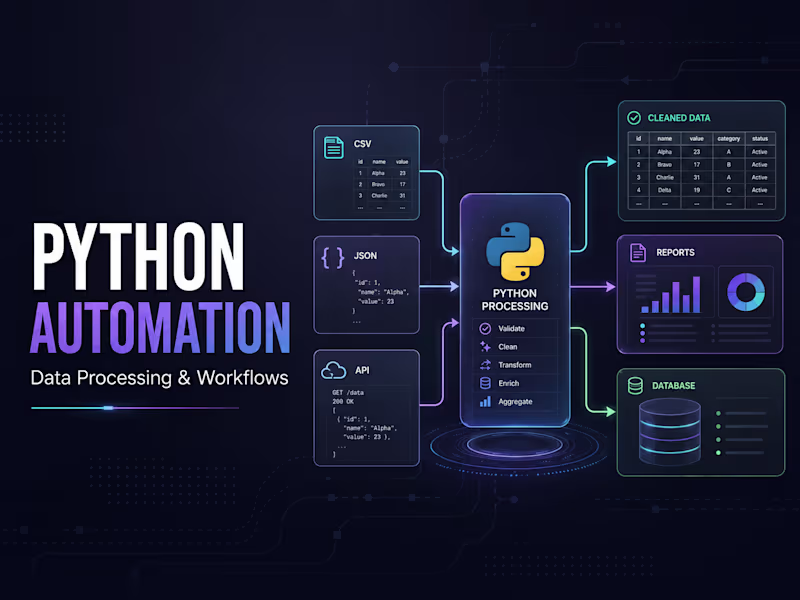
• Data cleaning and validation
• A deployed interactive Streamlit dashboard
The goal is not simply to display charts, but to turn customer data into understandable insights that can support retention decisions.
I can adapt the analysis, metrics, filters, and dashboard structure to your business and available data.
A live example of this type of dashboard is available in my portfolio.
FAQs
Example work
Starting at$150
Duration3 days
Tags
Microsoft Excel

pandas

Plotly
Python

Streamlit

Business Analyst
Business Intelligence
Data Analyst
Data Visualizer
Service provided by
Nisa Tek Antalya, Turkey
- 3
- Followers
Interactive Customer Churn & Retention DashboardNisa Tek
Starting at$150
Duration3 days
Tags
Microsoft Excel
pandas
Plotly
Python
Streamlit
Business Analyst
Business Intelligence
Data Analyst
Data Visualizer
Turn your customer data into a clear, interactive retention analytics dashboard that helps identify churn patterns, high-risk customer segments, and areas that deserve attention.
I build custom customer churn and retention dashboards using Python, Pandas, Streamlit, and Plotly. Your raw CSV or Excel data will be cleaned, validated, analyzed, and transformed into an interactive dashboard designed for practical business use.
Depending on your dataset and requirements, the dashboard can include:
• Customer churn and retention KPIs
• High-risk customer segment analysis
• Contract and customer tenure analysis
• Interactive filters and visualizations
• Churn driver and reported reason analysis
• Customer segment comparisons
• Financial exposure and revenue-related metrics
• Downloadable CSV and Excel reports
• Data cleaning and validation
• A deployed interactive Streamlit dashboard
The goal is not simply to display charts, but to turn customer data into understandable insights that can support retention decisions.
I can adapt the analysis, metrics, filters, and dashboard structure to your business and available data.
A live example of this type of dashboard is available in my portfolio.
FAQs
Example work
$150