
Data Visualization & DashboardsMariam Olatunji
Turning Complex Data into Clear, Actionable Business Intelligence
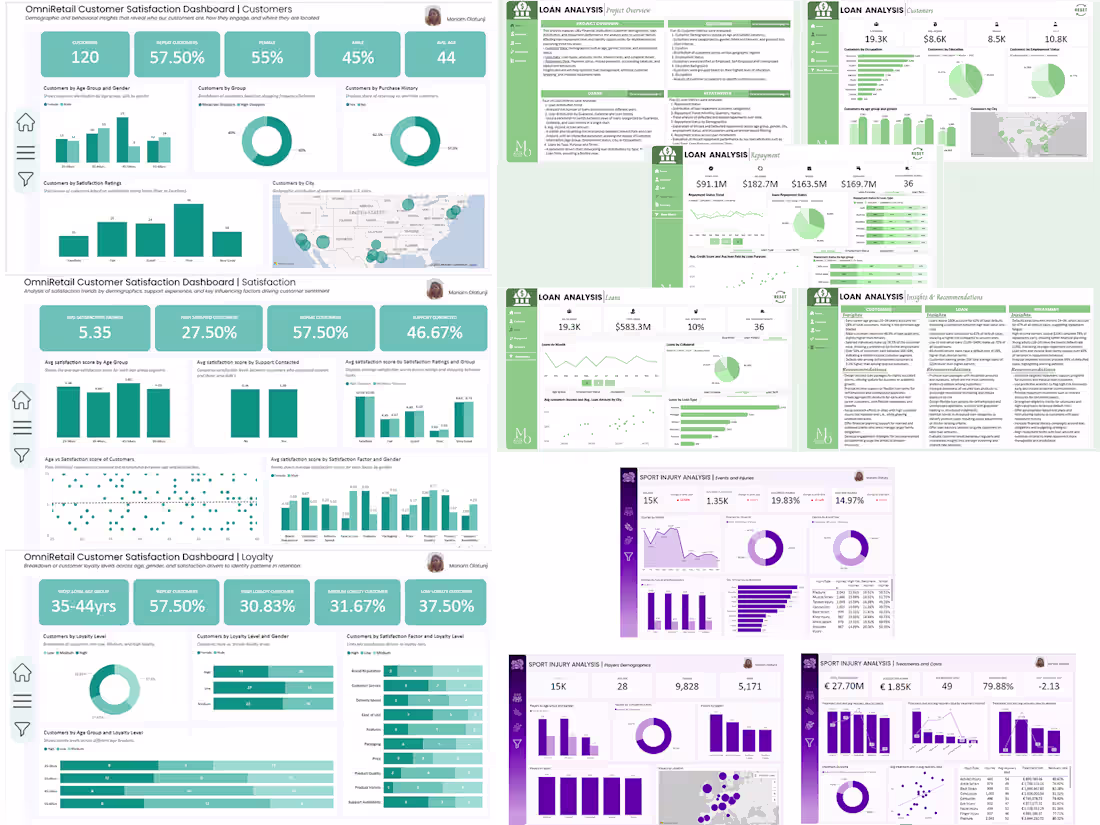
I'll be your partner in making data accessible and meaningful for everyone in your organization, from C-suite executives to frontline teams. As a visualization specialist, I'll transform your raw numbers into compelling stories that drive informed decision-making across all levels.
What to expect: I'll create interactive dashboards with automated data connections, intuitive navigation, and mobile optimization. You'll receive comprehensive training on dashboard usage, interpretation, and maintenance to ensure maximum value from your investment.
You're not just getting charts and graphs - I genuinely want to empower your team to discover insights and make confident, data-driven decisions every day.
What's included
Interactive Dashboard Suite
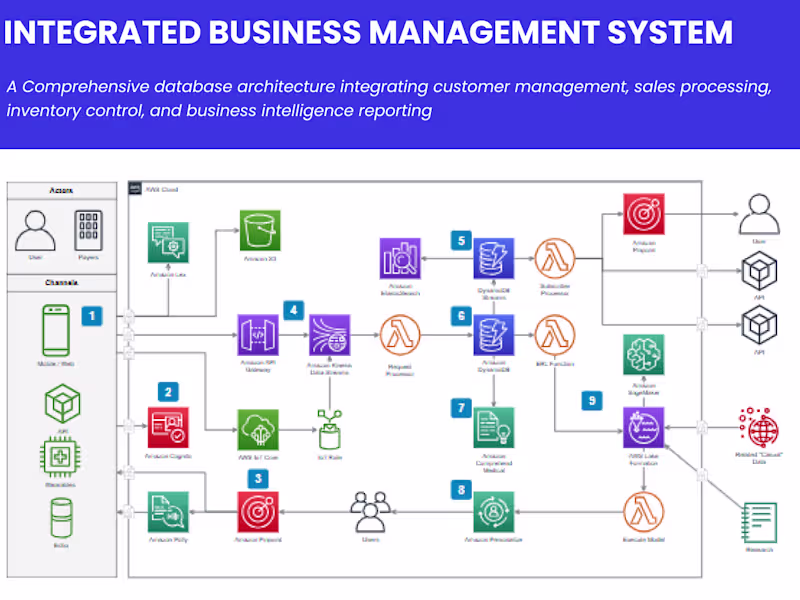
Dynamic, real-time visualization platform with filtering, drill-down capabilities, and automated refresh. Transforms complex data into intuitive visuals that anyone can navigate and understand instantly.
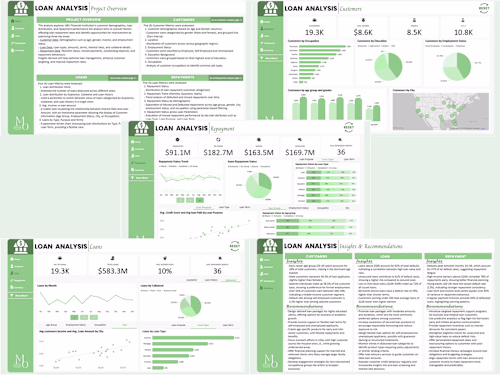
Executive KPI Summary Boards
High-level strategic dashboards designed specifically for leadership decision-making. Clean, professional layouts that highlight critical metrics and trends at a glance.
Custom Analytics Workbook
Comprehensive analysis documents featuring multiple chart types, trend analysis, and comparative insights. Includes detailed explanations and actionable recommendations based on data patterns.
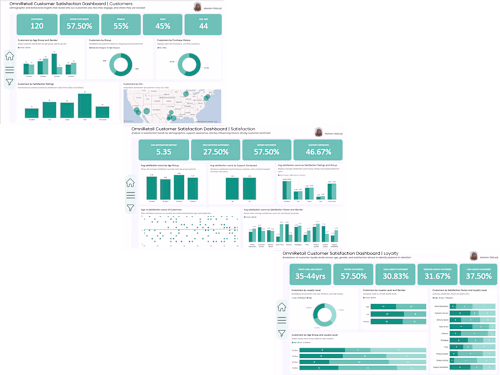
Mobile-Responsive Dashboard Views
Optimized versions that work seamlessly on phones and tablets, ensuring access to critical insights anywhere. Perfect for executives and field teams who need data on-the-go
Automated Report Generation
Scheduled reports that automatically generate and distribute key insights to stakeholders via email or shared folders. Saves hours of manual reporting while ensuring consistent communication.
Data Story Presentations
Compelling narrative presentations that explain key findings and recommendations to non-technical audiences. Perfect for board meetings or stakeholder presentations.
Dashboard User Training Materials
Video tutorials, quick reference guides, and best practices documentation that ensure your team maximizes dashboard value and adoption across the organization.
FAQs
Mariam's other services
Starting at$800
Duration2 weeks
Tags
Figma
Matplotlib
Microsoft Excel
Microsoft Power BI
Tableau
Data Analyst
Data Visualizer
Service provided by
Mariam Olatunji Lagos, Nigeria
- 1
- Followers
Data Visualization & DashboardsMariam Olatunji
Starting at$800
Duration2 weeks
Tags
Figma
Matplotlib
Microsoft Excel
Microsoft Power BI
Tableau
Data Analyst
Data Visualizer
Turning Complex Data into Clear, Actionable Business Intelligence
I'll be your partner in making data accessible and meaningful for everyone in your organization, from C-suite executives to frontline teams. As a visualization specialist, I'll transform your raw numbers into compelling stories that drive informed decision-making across all levels.
What to expect: I'll create interactive dashboards with automated data connections, intuitive navigation, and mobile optimization. You'll receive comprehensive training on dashboard usage, interpretation, and maintenance to ensure maximum value from your investment.
You're not just getting charts and graphs - I genuinely want to empower your team to discover insights and make confident, data-driven decisions every day.
What's included
Interactive Dashboard Suite
Dynamic, real-time visualization platform with filtering, drill-down capabilities, and automated refresh. Transforms complex data into intuitive visuals that anyone can navigate and understand instantly.
Executive KPI Summary Boards
High-level strategic dashboards designed specifically for leadership decision-making. Clean, professional layouts that highlight critical metrics and trends at a glance.
Custom Analytics Workbook
Comprehensive analysis documents featuring multiple chart types, trend analysis, and comparative insights. Includes detailed explanations and actionable recommendations based on data patterns.
Mobile-Responsive Dashboard Views
Optimized versions that work seamlessly on phones and tablets, ensuring access to critical insights anywhere. Perfect for executives and field teams who need data on-the-go
Automated Report Generation
Scheduled reports that automatically generate and distribute key insights to stakeholders via email or shared folders. Saves hours of manual reporting while ensuring consistent communication.
Data Story Presentations
Compelling narrative presentations that explain key findings and recommendations to non-technical audiences. Perfect for board meetings or stakeholder presentations.
Dashboard User Training Materials
Video tutorials, quick reference guides, and best practices documentation that ensure your team maximizes dashboard value and adoption across the organization.
FAQs
Mariam's other services
$800