
Data Analysis & Visualization with Excel, Python & Power BIGabriel Johnson
I offer expert data analysis services to help businesses turn raw data into clear, actionable insights. With hands-on experience in Python, SQL, Excel, and Power BI, I deliver clean datasets, insightful reports, and interactive dashboards. What sets me apart is my ability to translate complex data into simple strategies that drive real business results.
What's included
Exploratory Data Analysis (EDA) report
Initial deep-dive analysis of your dataset to understand distributions, outliers, relationships, and hidden insights.
Cleaned and Organized Datasets (CSV, Excel, or SQL)
Raw data will be thoroughly cleaned, formatted, and structured to ensure accuracy and usability in your preferred file format.
Insightful Summary Reports with Key Findings
A concise report highlighting major trends, patterns, and actionable insights discovered during the analysis.
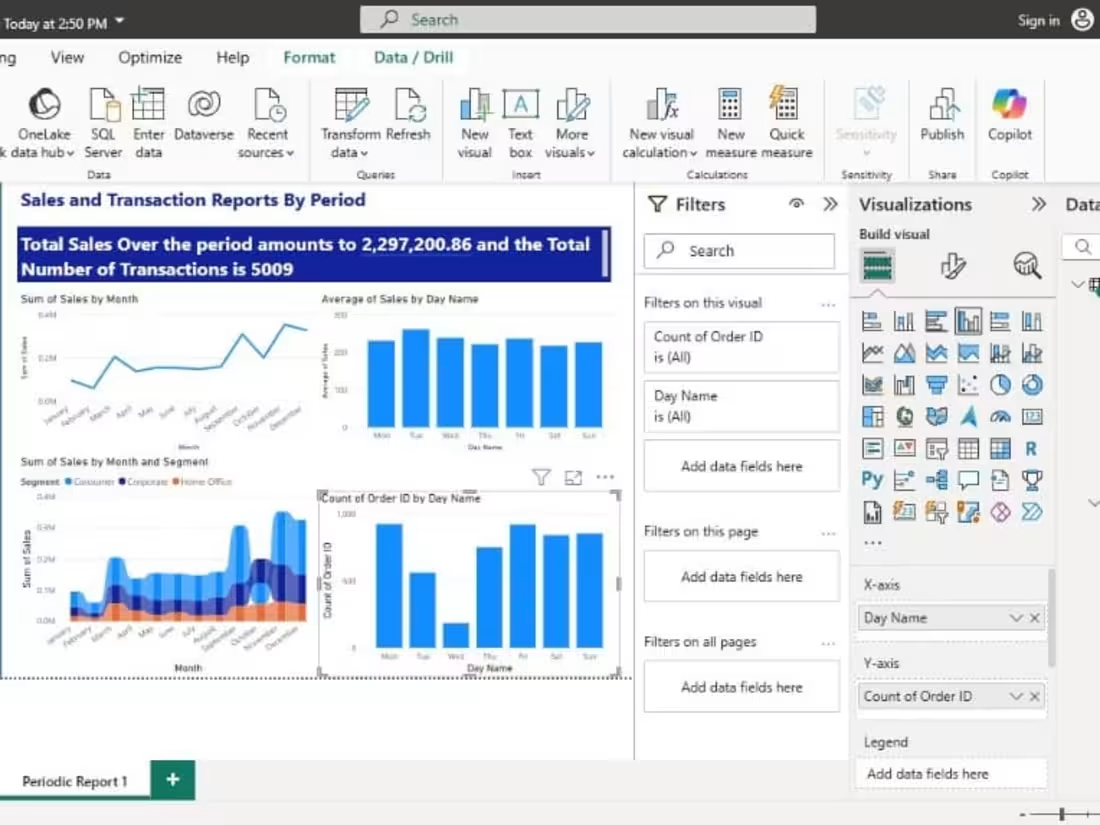
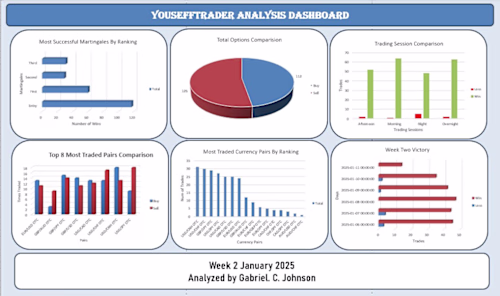
Interactive Dashboards (Power BI or Excel)
User-friendly dashboards that display real-time or static data visuals, allowing you to explore performance metrics at a glance.
Data Visualizations (Charts, Graphs, Trends)
Custom visuals such as bar charts, pie charts, and line graphs that simplify complex data and make trends easy to understand.
SQL Queries or Scripts (If Needed)
Efficient, well-documented SQL queries to extract, filter, or summarize your data from relational databases.
Actionable Recommendations Based on Analysis
Practical suggestions and business strategies backed by data to help you improve decision-making and outcomes.
Documentation or User Guide (Upon Request)
Clear instructions or documentation explaining how to interpret and interact with the data, reports, or dashboards delivered.
Example work
Starting at$250
Duration5 days
Tags
Matplotlib
Microsoft Excel
Microsoft Power BI
pandas
Python
Data Analyst
Data Scientist
Data Visualizer
Service provided by
Gabriel Johnson Lagos, Nigeria
- 3
- Followers
Data Analysis & Visualization with Excel, Python & Power BIGabriel Johnson
Starting at$250
Duration5 days
Tags
Matplotlib
Microsoft Excel
Microsoft Power BI
pandas
Python
Data Analyst
Data Scientist
Data Visualizer
I offer expert data analysis services to help businesses turn raw data into clear, actionable insights. With hands-on experience in Python, SQL, Excel, and Power BI, I deliver clean datasets, insightful reports, and interactive dashboards. What sets me apart is my ability to translate complex data into simple strategies that drive real business results.
What's included
Exploratory Data Analysis (EDA) report
Initial deep-dive analysis of your dataset to understand distributions, outliers, relationships, and hidden insights.
Cleaned and Organized Datasets (CSV, Excel, or SQL)
Raw data will be thoroughly cleaned, formatted, and structured to ensure accuracy and usability in your preferred file format.
Insightful Summary Reports with Key Findings
A concise report highlighting major trends, patterns, and actionable insights discovered during the analysis.
Interactive Dashboards (Power BI or Excel)
User-friendly dashboards that display real-time or static data visuals, allowing you to explore performance metrics at a glance.
Data Visualizations (Charts, Graphs, Trends)
Custom visuals such as bar charts, pie charts, and line graphs that simplify complex data and make trends easy to understand.
SQL Queries or Scripts (If Needed)
Efficient, well-documented SQL queries to extract, filter, or summarize your data from relational databases.
Actionable Recommendations Based on Analysis
Practical suggestions and business strategies backed by data to help you improve decision-making and outcomes.
Documentation or User Guide (Upon Request)
Clear instructions or documentation explaining how to interpret and interact with the data, reports, or dashboards delivered.
Example work
$250