
Interactive Data Visualization Dashboards with Power BIROHAN MISHRA
I create custom, interactive Power BI dashboards that transform raw data into actionable insights, enabling businesses to make informed decisions. With expertise in data modeling, DAX calculations, and SQL, I deliver visually compelling and easy-to-use reports, ensuring clarity and usability for stakeholders. My focus on fast delivery and attention to detail sets me apart, providing high-quality solutions tailored to your needs.
What's included
Interactive Power BI Dashboard
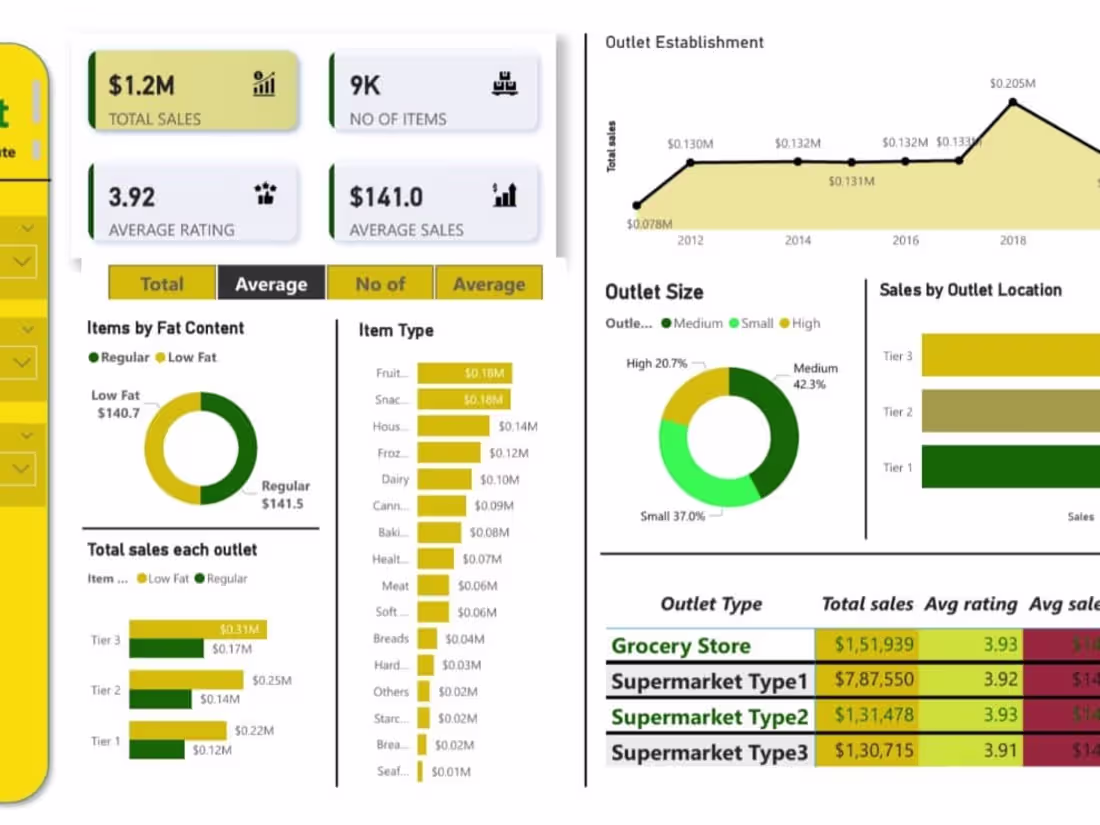
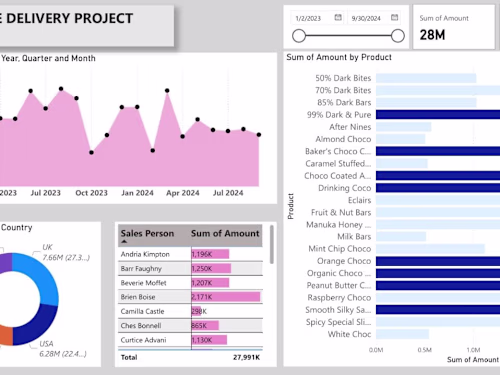
A fully customized, interactive Power BI dashboard featuring dynamic visualizations, slicers, and filters to provide actionable insights into your data. The dashboard will include key performance indicators (KPIs), trends, and comparisons to support data-driven decision-making.
Data Cleaning and Transformation Report
A detailed report documenting the data cleaning and transformation process, including data preparation steps, applied formulas, and corrections made to ensure accuracy and consistency.
DAX Calculations and Measures Documentation
A comprehensive file outlining the DAX formulas and measures used within the dashboard to calculate KPIs, metrics, and custom calculations.
Example work
ROHAN 's other services

Starting at$20
Duration4 days
Tags
Microsoft Excel
Microsoft Power BI
MySQL
Data Analyst
Data Modelling Analyst
Data Visualizer
Service provided by
ROHAN MISHRA Madurai, India
- 1
- Followers
Interactive Data Visualization Dashboards with Power BIROHAN MISHRA
Starting at$20
Duration4 days
Tags
Microsoft Excel
Microsoft Power BI
MySQL
Data Analyst
Data Modelling Analyst
Data Visualizer
I create custom, interactive Power BI dashboards that transform raw data into actionable insights, enabling businesses to make informed decisions. With expertise in data modeling, DAX calculations, and SQL, I deliver visually compelling and easy-to-use reports, ensuring clarity and usability for stakeholders. My focus on fast delivery and attention to detail sets me apart, providing high-quality solutions tailored to your needs.
What's included
Interactive Power BI Dashboard
A fully customized, interactive Power BI dashboard featuring dynamic visualizations, slicers, and filters to provide actionable insights into your data. The dashboard will include key performance indicators (KPIs), trends, and comparisons to support data-driven decision-making.
Data Cleaning and Transformation Report
A detailed report documenting the data cleaning and transformation process, including data preparation steps, applied formulas, and corrections made to ensure accuracy and consistency.
DAX Calculations and Measures Documentation
A comprehensive file outlining the DAX formulas and measures used within the dashboard to calculate KPIs, metrics, and custom calculations.
Example work
ROHAN 's other services
$20