
DATA VISUALISATION USING POWER BI ANNA DUFIE AFRIYIE
I design interactive Power BI dashboards that transform e-commerce data into clear, actionable insights. My focus is on helping businesses understand sales performance, customer behavior, and profit trends through visual storytelling and data-driven analysis. Each project blends accuracy, creativity, and business strategy to support smarter decisions and measurable growth.
What's included
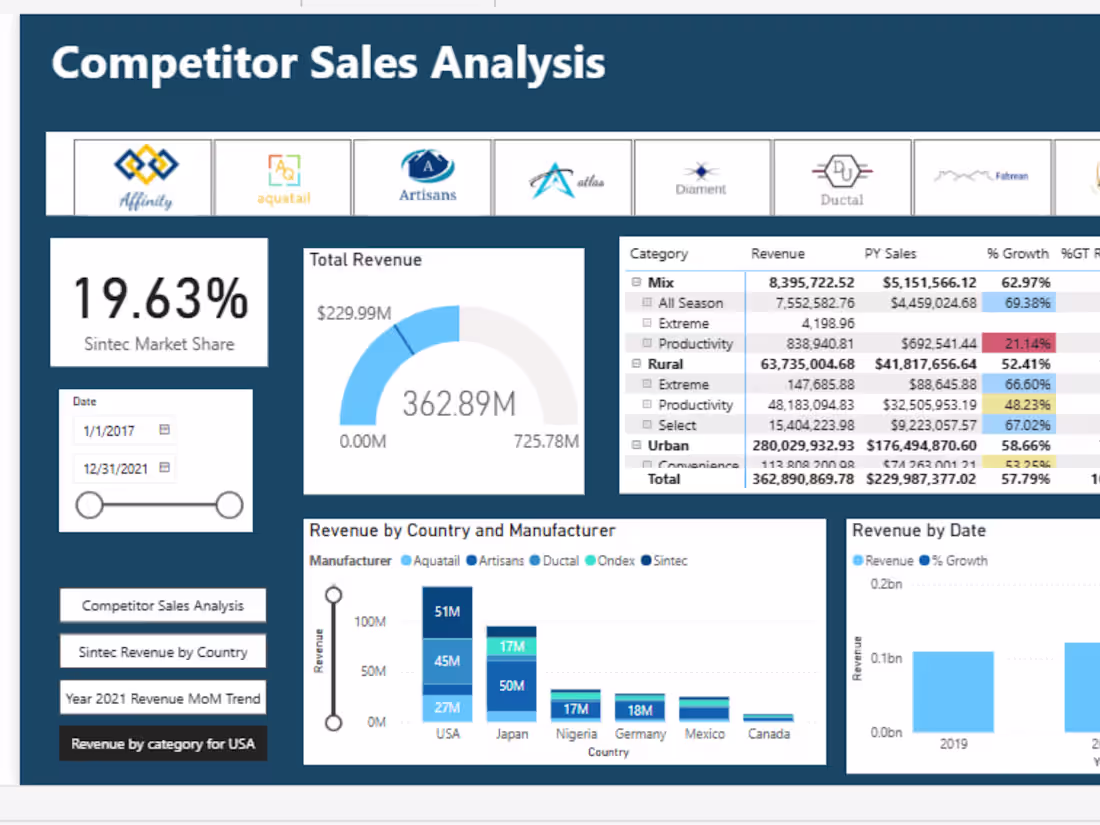
E-Commerce Performance Dashboard
An interactive Power BI dashboard that visualizes key metrics such as total sales, profit margins, top products, category performance, and shipping trends to help you make informed decisions and identify growth opportunities.
Data Insights Summary Report .
A concise report highlighting patterns in customer purchases, profit drivers, and regional performance, including actionable recommendations for improving sales and operational efficiency
Cleaned Dataset and Source Files
Well-organized Excel or CSV datasets used for analysis, including all data transformations and measures for transparency and reusability.

Contact for pricing
Tags
Microsoft Power BI
Data Analyst
Market Researcher
Researcher
Service provided by
ANNA DUFIE AFRIYIE Accra, Ghana
- 13
- Followers
DATA VISUALISATION USING POWER BI ANNA DUFIE AFRIYIE
I design interactive Power BI dashboards that transform e-commerce data into clear, actionable insights. My focus is on helping businesses understand sales performance, customer behavior, and profit trends through visual storytelling and data-driven analysis. Each project blends accuracy, creativity, and business strategy to support smarter decisions and measurable growth.
What's included
E-Commerce Performance Dashboard
An interactive Power BI dashboard that visualizes key metrics such as total sales, profit margins, top products, category performance, and shipping trends to help you make informed decisions and identify growth opportunities.
Data Insights Summary Report .
A concise report highlighting patterns in customer purchases, profit drivers, and regional performance, including actionable recommendations for improving sales and operational efficiency
Cleaned Dataset and Source Files
Well-organized Excel or CSV datasets used for analysis, including all data transformations and measures for transparency and reusability.
Contact for pricing