
Data-bound charts and dashboard motion in RiveValerio Donfrancesco
Dashboards usually animate badly: a chart library's default tween, or a GIF that can't show real numbers. I build the visual layer in Rive instead, with data binding, so your app sets the values and the animation follows: lines that grow, totals that count, states that react to hover and tap.
What I can build for you
Animated charts and flows: bars, rings, gauges, flow maps and progress, with widths, heights and colors bound to your data.
KPI cards and counters that animate between real values, not between fixed keyframes.
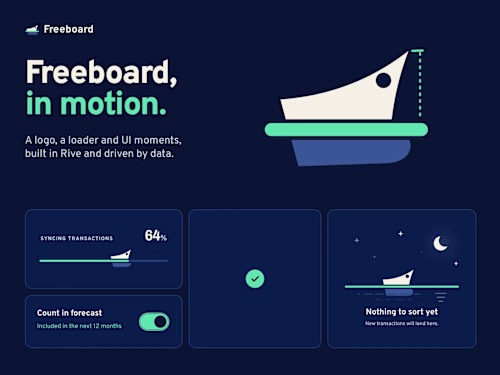
Empty, loading, success and error states for dashboards, designed as one system.
Onboarding and first-data moments that explain a dashboard while it fills up.
How I work
Brief: your data model, the screens, the states each component needs.
A motion concept on one key component, before building the rest.
Build in Rive: view models, converters and state machines, written fast with the Rive CLI and an AI coding agent, then refined by hand.
Handoff: the .riv file, the view model documented (names, types, ranges) and help wiring it into your web, iOS or Android app.
Why me
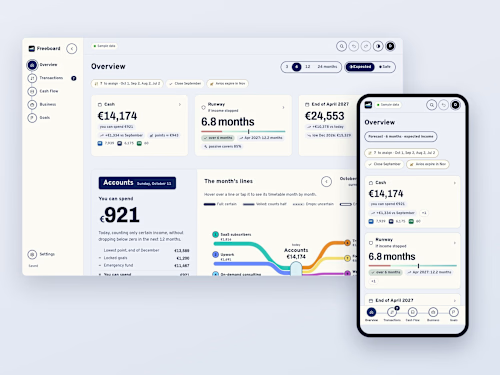
I'm a senior UX/UI designer for SaaS and web apps, with 11 years as an iOS developer. I design dashboards for a living, including Freeboard, my own finance app, so the motion serves reading the numbers first. Accessibility is part of the work: reduced motion, states readable without color, real text instead of baked-in labels.
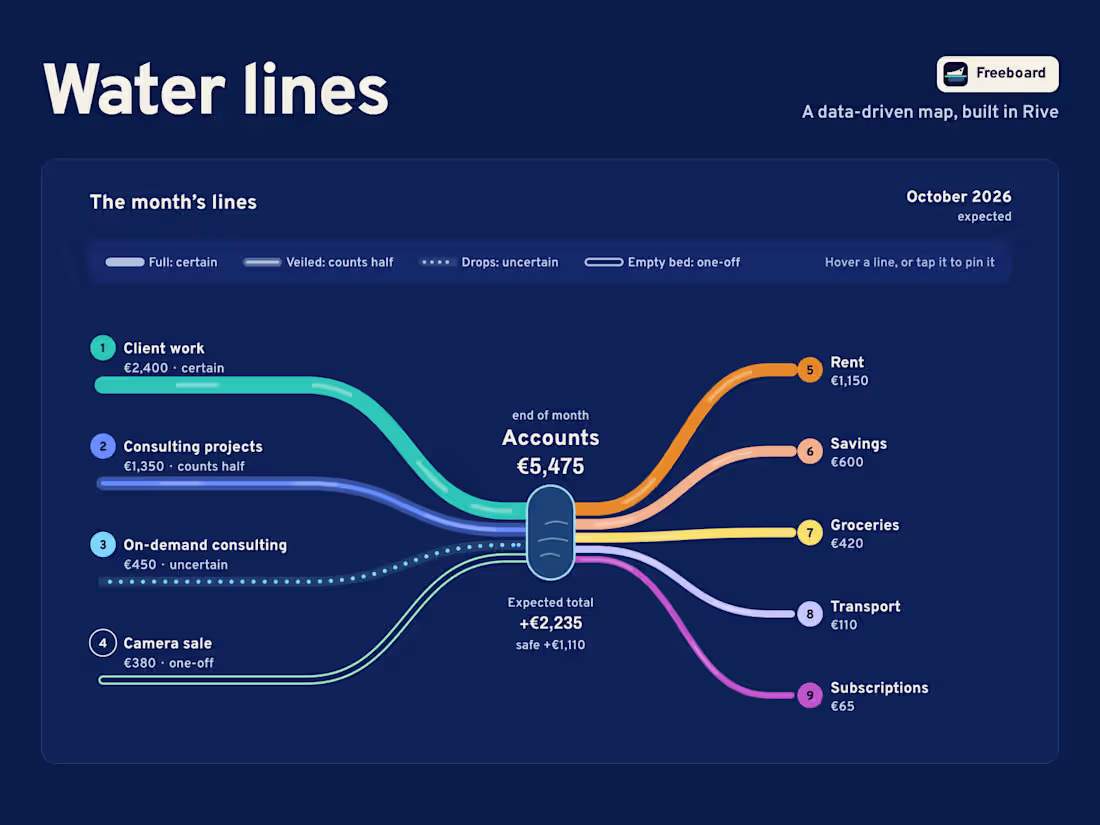
Recent work: Water lines, Freeboard's cash-flow map rebuilt in Rive, where income and spending are rivers whose width comes from the data. Live demo: https://freeboard.money/rive/water-lines/
What's included
Rive file (.riv) with view models, state machines and named inputs
Up to 2 rounds of revisions
Data binding guide for your developers (web, iOS or Android)
One call to hand it over
FAQs
Example work
Starting at$1,200
Duration2 weeks
Tags
Claude

Rive

Data Visualizer
Interaction Designer
Motion Designer
UI Designer
FinTech & Payments
Service provided by
Valerio Donfrancesco proRome, Italy
- 6
- Followers
Data-bound charts and dashboard motion in RiveValerio Donfrancesco
Starting at$1,200
Duration2 weeks
Tags
Claude
Rive
Data Visualizer
Interaction Designer
Motion Designer
UI Designer
FinTech & Payments
Dashboards usually animate badly: a chart library's default tween, or a GIF that can't show real numbers. I build the visual layer in Rive instead, with data binding, so your app sets the values and the animation follows: lines that grow, totals that count, states that react to hover and tap.
What I can build for you
Animated charts and flows: bars, rings, gauges, flow maps and progress, with widths, heights and colors bound to your data.
KPI cards and counters that animate between real values, not between fixed keyframes.
Empty, loading, success and error states for dashboards, designed as one system.
Onboarding and first-data moments that explain a dashboard while it fills up.
How I work
Brief: your data model, the screens, the states each component needs.
A motion concept on one key component, before building the rest.
Build in Rive: view models, converters and state machines, written fast with the Rive CLI and an AI coding agent, then refined by hand.
Handoff: the .riv file, the view model documented (names, types, ranges) and help wiring it into your web, iOS or Android app.
Why me
I'm a senior UX/UI designer for SaaS and web apps, with 11 years as an iOS developer. I design dashboards for a living, including Freeboard, my own finance app, so the motion serves reading the numbers first. Accessibility is part of the work: reduced motion, states readable without color, real text instead of baked-in labels.
Recent work: Water lines, Freeboard's cash-flow map rebuilt in Rive, where income and spending are rivers whose width comes from the data. Live demo: https://freeboard.money/rive/water-lines/
What's included
Rive file (.riv) with view models, state machines and named inputs
Up to 2 rounds of revisions
Data binding guide for your developers (web, iOS or Android)
One call to hand it over
FAQs
Example work
$1,200