
Excel Data Analytics and VisualizationDikshant Choudhary
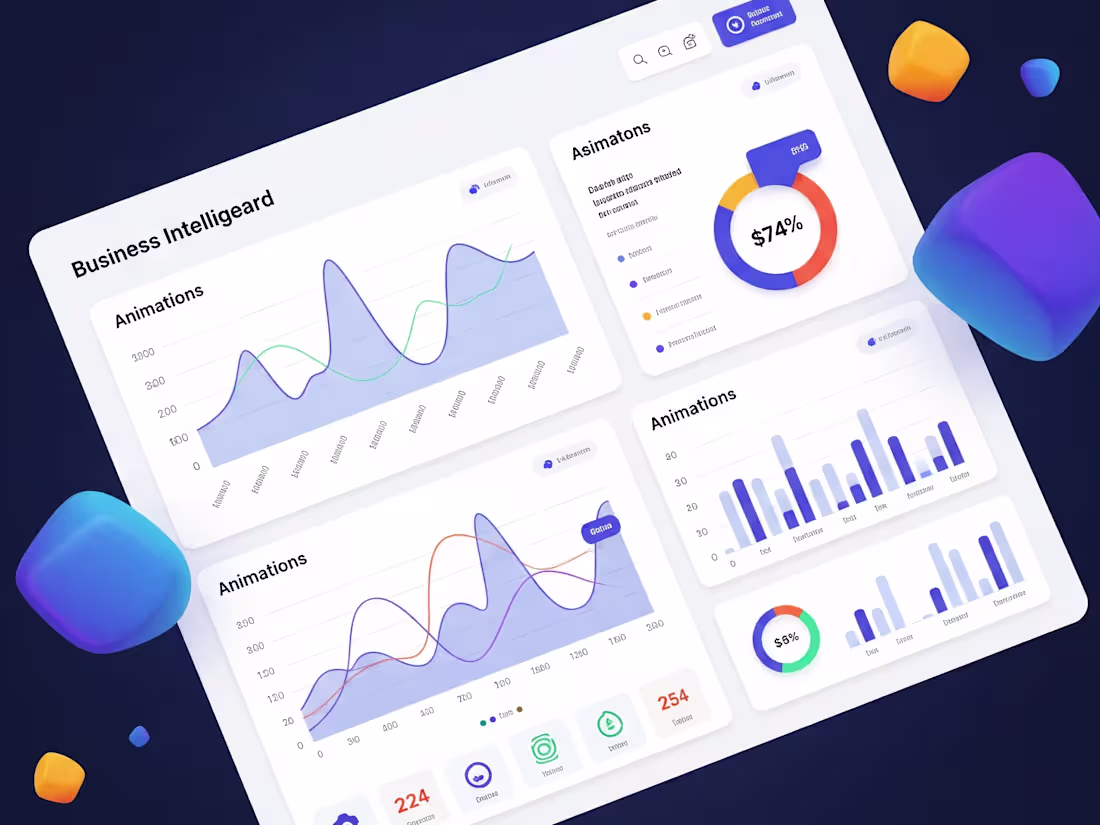
I build custom, interactive Excel dashboards that turn your complex data into clear, actionable insights. My service is unique because I handle the entire process—from cleaning and structuring your data with advanced formulas to designing a polished visual tool—delivering a complete solution that empowers you to make data-driven decisions with confidence.
What's included
Structured Data & Formula Engine
Description: This is the clean, organized foundation of your dashboard. I will take your raw data, structure it in a proper Excel Table, and create a "calculation engine" sheet with all the necessary formulas to power your dashboard's visuals.
Format: Microsoft Excel Workbook (.xlsx)
Quantity: 1 backend data sheet and 1 calculation sheet
Custom Interactive Dashboard
Description: The primary deliverable. A polished, single-sheet dashboard featuring a variety of charts, graphs, and KPI cards to visualize your data. It will include interactive slicers and timelines, allowing you to filter your data by date, category, region, or any other relevant metric.
Format: Microsoft Excel Workbook (.xlsx)
Quantity: 1 interactive dashboard with up to 8 key visual elements (charts, tables, etc.).
Quick Start User Guide
Description: A simple, one-page guide that explains how to add new data to the file and refresh the dashboard. This will empower you to keep your dashboard updated and use it effectively without needing my ongoing support.
Format: PDF Document
Quantity: 1 user guide

Dikshant's other services

Contact for pricing
Tags
Microsoft Excel
Data Analyst
Data Scientist
Data Science Specialist
Service provided by
Dikshant Choudhary Udaipur, India
Excel Data Analytics and VisualizationDikshant Choudhary
Contact for pricing
Tags
Microsoft Excel
Data Analyst
Data Scientist
Data Science Specialist
I build custom, interactive Excel dashboards that turn your complex data into clear, actionable insights. My service is unique because I handle the entire process—from cleaning and structuring your data with advanced formulas to designing a polished visual tool—delivering a complete solution that empowers you to make data-driven decisions with confidence.
What's included
Structured Data & Formula Engine
Description: This is the clean, organized foundation of your dashboard. I will take your raw data, structure it in a proper Excel Table, and create a "calculation engine" sheet with all the necessary formulas to power your dashboard's visuals.
Format: Microsoft Excel Workbook (.xlsx)
Quantity: 1 backend data sheet and 1 calculation sheet
Custom Interactive Dashboard
Description: The primary deliverable. A polished, single-sheet dashboard featuring a variety of charts, graphs, and KPI cards to visualize your data. It will include interactive slicers and timelines, allowing you to filter your data by date, category, region, or any other relevant metric.
Format: Microsoft Excel Workbook (.xlsx)
Quantity: 1 interactive dashboard with up to 8 key visual elements (charts, tables, etc.).
Quick Start User Guide
Description: A simple, one-page guide that explains how to add new data to the file and refresh the dashboard. This will empower you to keep your dashboard updated and use it effectively without needing my ongoing support.
Format: PDF Document
Quantity: 1 user guide
Dikshant's other services
Contact for pricing