
E-commerce Growth Intelligence & KPI DashboardHayeni Samuel
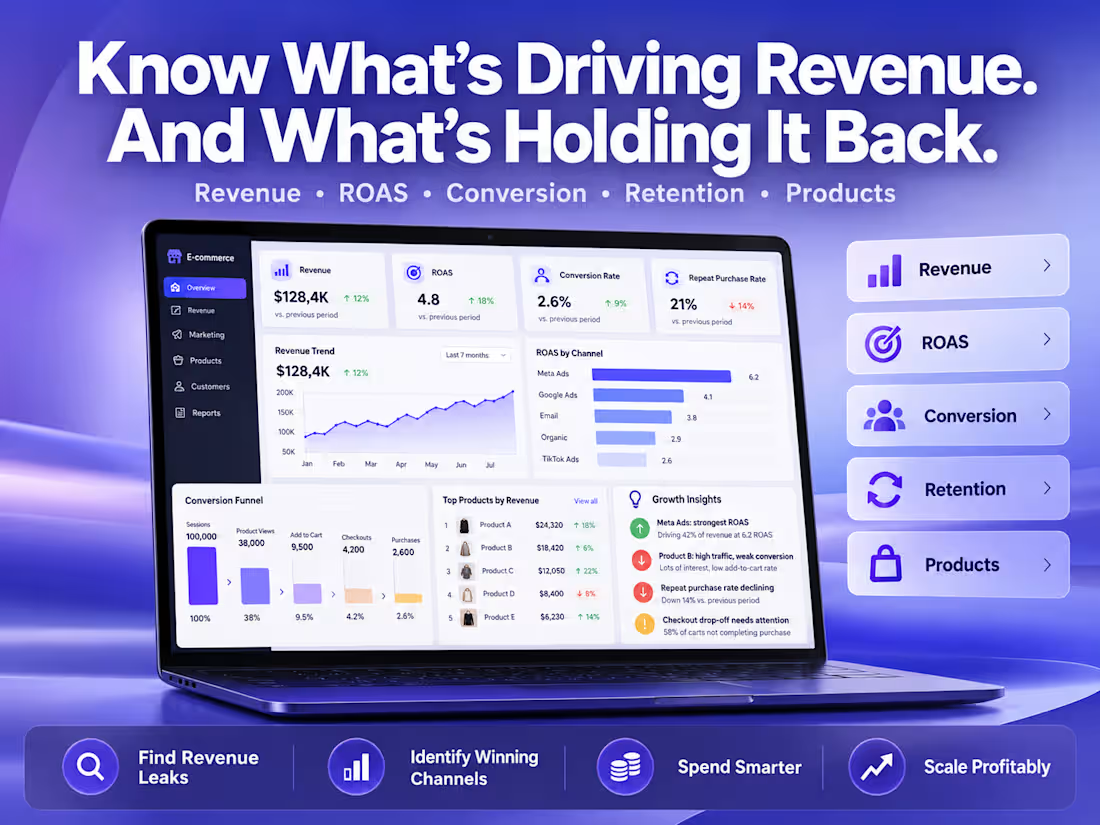
Your store already generates plenty of data. The problem is knowing which numbers matter, what’s hurting performance, and where the strongest growth opportunities are.
I build e-commerce growth intelligence dashboards that bring your sales, marketing, customer, and product data into one clear decision-making system.
Instead of jumping between Shopify, ad platforms, spreadsheets, CRM tools, and marketing reports, you get a reliable view of how your store is actually performing.
I can help you track and analyze:
Revenue, orders, AOV, and sales trends
Conversion rates and funnel drop-offs
ROAS, CAC, and marketing efficiency
Product and category performance
Customer retention and repeat purchases
Channel and campaign performance
Customer and channel profitability
Revenue by source and acquisition channel
Growth trends and unusual KPI changes
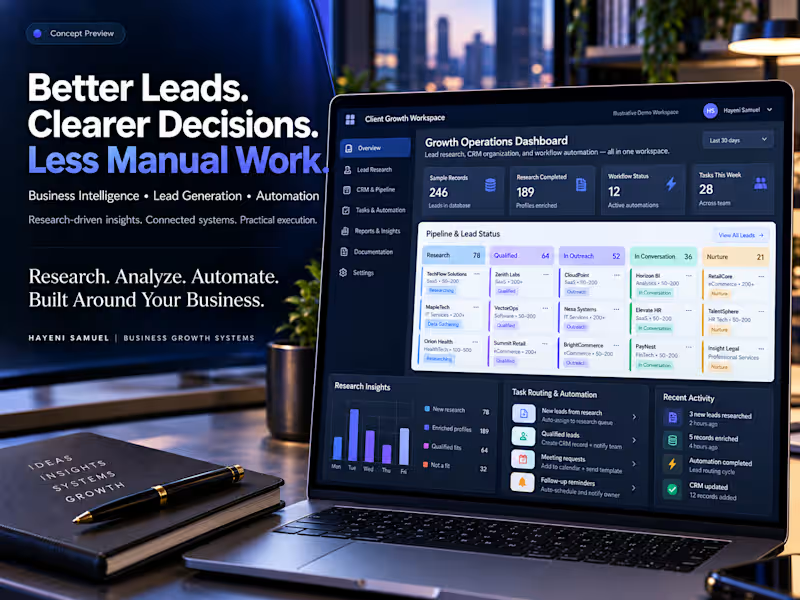
More Than Just a Dashboard Before building the dashboard, I review and organize the available data so the reporting is based on the most reliable information your systems provide.
I can work with common e-commerce data sources such as Shopify, WooCommerce, advertising platforms, CRM systems, marketing platforms, spreadsheets, databases, and APIs.
Where data sources disagree or tracking is incomplete, I highlight those limitations rather than presenting uncertain numbers as facts.
What You Receive Your project includes:
One interactive e-commerce growth dashboard
Up to 3 connected data sources
KPI and metric architecture
Data cleaning and organization
Product, channel, and funnel analysis
Interactive filters and reporting views
Automated or scheduled refresh where supported
Data validation and testing
A written Growth Insights Summary
Prioritized findings and recommended actions
Documentation and handover
1 revision round
Growth Insights Summary I don’t simply hand over charts. I review the dashboard and highlight areas such as:
Where performance appears to be leaking
Which products are contributing most to growth
Which channels are producing stronger results
Where customers are dropping from the funnel
Where acquisition costs may be becoming inefficient
Which retention metrics deserve attention
Where deeper investigation or optimization may be needed
Recommendations are based on the available data not generic e-commerce advice.
The Outcome
You leave with a clearer understanding of:
What’s working.
What needs attention.
Where money may be leaking.
Which opportunities deserve further investment.
The goal is to help you make faster, more informed decisions about your marketing, products, customers, and growth strategy.
Complex attribution modeling, advanced custom APIs, additional data sources, or large historical datasets can be scoped separately.
FAQs
Starting at$650
Duration5 days
Tags
Google Analytics

Microsoft Power BI

Shopify

Business Intelligence
Data Analyst
Marketing Analytics Specialist
E-Commerce
KPI Dashboard
Performance Reporting
Service provided by
Hayeni Samuel Los Angeles, USA
- 7
- Followers
E-commerce Growth Intelligence & KPI DashboardHayeni Samuel
Starting at$650
Duration5 days
Tags
Google Analytics
Microsoft Power BI
Shopify
Business Intelligence
Data Analyst
Marketing Analytics Specialist
E-Commerce
KPI Dashboard
Performance Reporting
Your store already generates plenty of data. The problem is knowing which numbers matter, what’s hurting performance, and where the strongest growth opportunities are.
I build e-commerce growth intelligence dashboards that bring your sales, marketing, customer, and product data into one clear decision-making system.
Instead of jumping between Shopify, ad platforms, spreadsheets, CRM tools, and marketing reports, you get a reliable view of how your store is actually performing.
I can help you track and analyze:
Revenue, orders, AOV, and sales trends
Conversion rates and funnel drop-offs
ROAS, CAC, and marketing efficiency
Product and category performance
Customer retention and repeat purchases
Channel and campaign performance
Customer and channel profitability
Revenue by source and acquisition channel
Growth trends and unusual KPI changes
More Than Just a Dashboard Before building the dashboard, I review and organize the available data so the reporting is based on the most reliable information your systems provide.
I can work with common e-commerce data sources such as Shopify, WooCommerce, advertising platforms, CRM systems, marketing platforms, spreadsheets, databases, and APIs.
Where data sources disagree or tracking is incomplete, I highlight those limitations rather than presenting uncertain numbers as facts.
What You Receive Your project includes:
One interactive e-commerce growth dashboard
Up to 3 connected data sources
KPI and metric architecture
Data cleaning and organization
Product, channel, and funnel analysis
Interactive filters and reporting views
Automated or scheduled refresh where supported
Data validation and testing
A written Growth Insights Summary
Prioritized findings and recommended actions
Documentation and handover
1 revision round
Growth Insights Summary I don’t simply hand over charts. I review the dashboard and highlight areas such as:
Where performance appears to be leaking
Which products are contributing most to growth
Which channels are producing stronger results
Where customers are dropping from the funnel
Where acquisition costs may be becoming inefficient
Which retention metrics deserve attention
Where deeper investigation or optimization may be needed
Recommendations are based on the available data not generic e-commerce advice.
The Outcome
You leave with a clearer understanding of:
What’s working.
What needs attention.
Where money may be leaking.
Which opportunities deserve further investment.
The goal is to help you make faster, more informed decisions about your marketing, products, customers, and growth strategy.
Complex attribution modeling, advanced custom APIs, additional data sources, or large historical datasets can be scoped separately.
FAQs
$650