
SRE-in-a-Box: Full Observability Stack SetupNeil Hanlon
I’ll set up a full-featured observability stack—Prometheus, Grafana, Loki, and more—so your team can stop guessing and start responding faster. This service is perfect for fast-moving teams that need real monitoring, not just logs in a terminal. I bring years of SRE and infra experience, and I design systems that work even when everything else breaks.
What's included
Prometheus + Alertmanager Configuration
Monitoring and alerting setup with routing, deduplication, grouping, and environment-based logic.
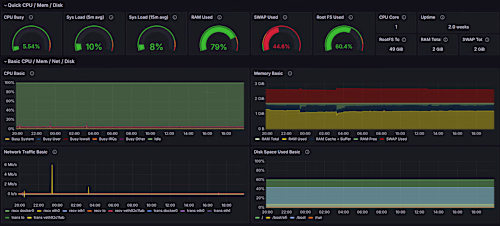
Grafana Dashboards with Auto-Discovery
Custom dashboards per service, using service discovery and templated views where possible.
Uptime Checks (Optional)
External uptime monitoring using Uptime Kuma for key endpoints and services.
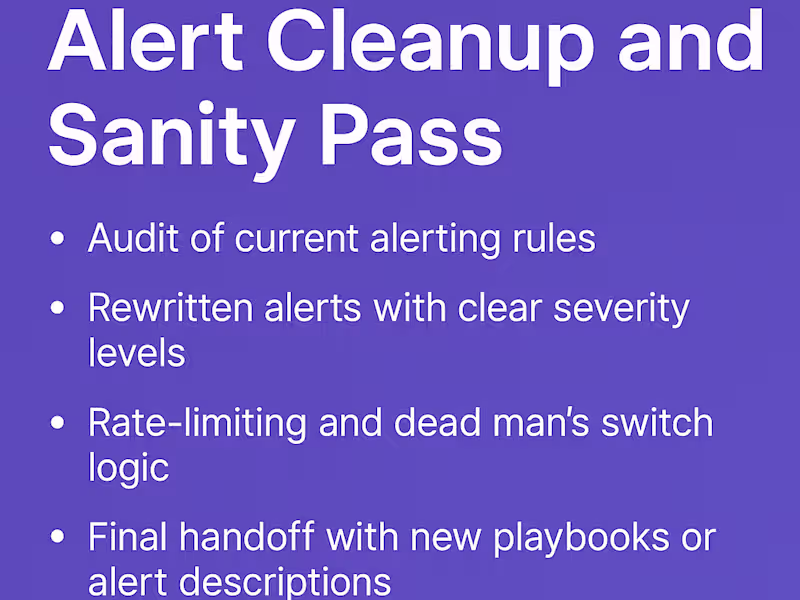
Alerting Policy and Escalation Plan
Initial alert policies and a customizable escalation matrix based on team roles and severity levels.
Deployment Automation
Turnkey setup delivered via Docker Compose, Helm, or Ansible—client’s choice.
FAQs
Starting at$2,500
Duration2 weeks
Tags
Ansible
AWS
Docker
Grafana
Prometheus
Cloud Infrastructure Architect
DevOps Engineer
Platform Engineer
Service provided by
Neil Hanlon Bedford, USA
SRE-in-a-Box: Full Observability Stack SetupNeil Hanlon
Starting at$2,500
Duration2 weeks
Tags
Ansible
AWS
Docker
Grafana
Prometheus
Cloud Infrastructure Architect
DevOps Engineer
Platform Engineer
I’ll set up a full-featured observability stack—Prometheus, Grafana, Loki, and more—so your team can stop guessing and start responding faster. This service is perfect for fast-moving teams that need real monitoring, not just logs in a terminal. I bring years of SRE and infra experience, and I design systems that work even when everything else breaks.
What's included
Prometheus + Alertmanager Configuration
Monitoring and alerting setup with routing, deduplication, grouping, and environment-based logic.
Grafana Dashboards with Auto-Discovery
Custom dashboards per service, using service discovery and templated views where possible.
Uptime Checks (Optional)
External uptime monitoring using Uptime Kuma for key endpoints and services.
Alerting Policy and Escalation Plan
Initial alert policies and a customizable escalation matrix based on team roles and severity levels.
Deployment Automation
Turnkey setup delivered via Docker Compose, Helm, or Ansible—client’s choice.
FAQs
$2,500