
Professional Data Analysis & Insights Using PythonSyed Ashar
I help businesses make sense of their data through expert analysis, visualization, and actionable insights. Whether it’s cleaning raw datasets, exploring trends, or building interactive dashboards in Python or Power BI — I deliver data solutions that drive smarter decisions.
What's included
Cleaned & Structured Dataset
I will clean, format, and organize your raw data, removing duplicates, handling missing values, and preparing it for analysis or reporting.
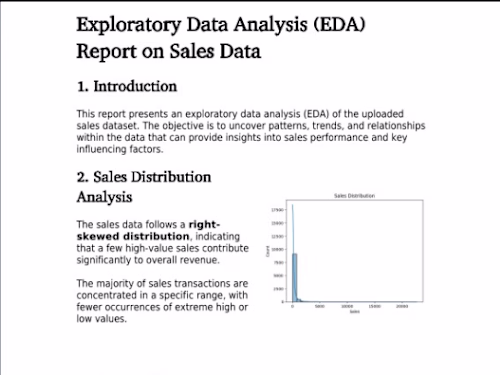
Exploratory Data Analysis (EDA) Report
I will provide a complete Exploratory Data Analysis (EDA) report with charts, trends, and key insights to help you understand patterns in your data.
Interactive Dashboard (Power BI or Python)
I will create an interactive and visually engaging dashboard that displays key metrics and insights, allowing you to filter and explore your data in real-time.
FAQs
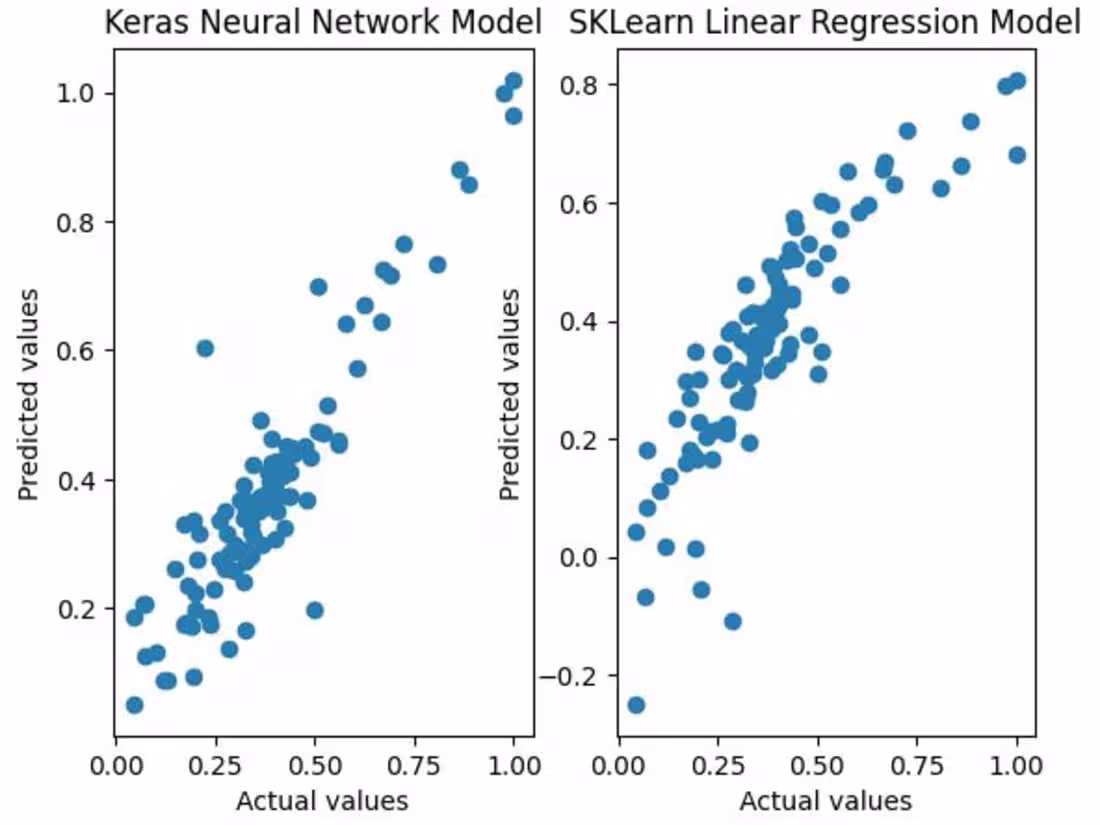
Example work
Starting at$20
Duration1 day
Tags
MATLAB
Microsoft Excel
pandas
Tableau
Data Analyst
Data Modelling Analyst
Data Scientist
Service provided by
Syed Ashar Rawalpindi, Pakistan
Professional Data Analysis & Insights Using PythonSyed Ashar
Starting at$20
Duration1 day
Tags
MATLAB
Microsoft Excel
pandas
Tableau
Data Analyst
Data Modelling Analyst
Data Scientist
I help businesses make sense of their data through expert analysis, visualization, and actionable insights. Whether it’s cleaning raw datasets, exploring trends, or building interactive dashboards in Python or Power BI — I deliver data solutions that drive smarter decisions.
What's included
Cleaned & Structured Dataset
I will clean, format, and organize your raw data, removing duplicates, handling missing values, and preparing it for analysis or reporting.
Exploratory Data Analysis (EDA) Report
I will provide a complete Exploratory Data Analysis (EDA) report with charts, trends, and key insights to help you understand patterns in your data.
Interactive Dashboard (Power BI or Python)
I will create an interactive and visually engaging dashboard that displays key metrics and insights, allowing you to filter and explore your data in real-time.
FAQs
Example work
$20