Interactive Power BI Dashboard

Starting at

$

50

About this service

Summary

You will get a customized interactive dashboard in Microsoft Power BI, easy to navigate visuals with a focus on interactivity and intuitive designs made up of dynamic graphs and charts. With my service, I also provide guidance to ensure that the user is trained on the elements and functionalities of the dashboard in order to empower them in leveraging the dashboard for decision making.

Process

Consultation & Requirements Gathering
Consultation and discussion to understand the data, business objectives and specific business requirements. This includes defining the relevant metrics needed to track, visualization goal and the audience.
Data Cleaning and Data Preparation
Ensuring that the available data is relevant to the business need, I will need to cleanse the data when necessary in order to eliminate errors, ensure consistency in format and accuracy.
Design and Dashboard Creation
Developing the customized dashboard in a way that aligns with the business objectives and implement interactive features that makes it easy to navigate. This will include dynamic charts and graphs.
Feedback and Review
Reviewing the visualizations and giving feedback on areas that need refining on the dashboard, it's functionality and relevance. Then, I will refine the visuals based on your input until the desired outcome is achieved.
Deployment and Support
Deploying the finalized visualization and offering support to answer further questions post-delivery as well as providing dashboard maintenance when needed.

FAQs

  • How often do I expect to hear from you?

    As often as will be necessary for the completion of the project

What's included

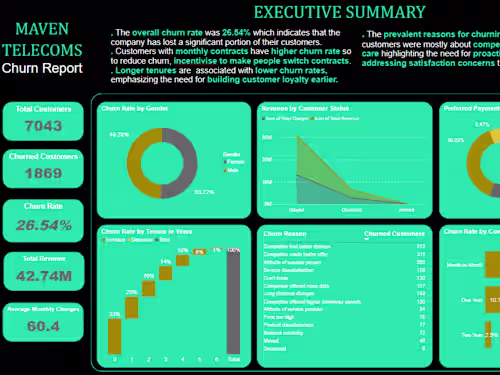
  • Interactive Power BI Dashboards

    Custom-designed and well-tailored dashboards that provide insightful data visualization with intuitive designs that are geared towards meeting the specific business requirements. These dashboards are interactive and easy to navigate.

  • Customized Reports

    Well detailed and customized reports that includes important metrics as well as key performance indicators, further providing insights to the analysis results. Recommendations based on the findings will also be included in the reports.

  • Data Integration and Source Connectivity

    Integration of the various data sources easily into Power BI to ensure easy access to them while exploring the data and visuals.

Example projects


Duration

3 days

Skills and tools

Data Visualizer

Business Analyst

Data Analyst

Microsoft Excel

Microsoft Excel

Microsoft Power BI

Microsoft Power BI

Industries

Sales

More services