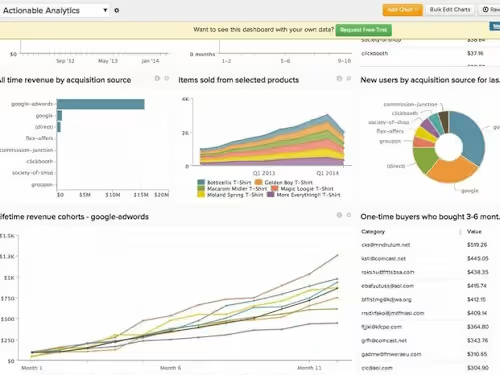
Data Visualization
Contact for pricing
About this service
Summary
What's included
Fully Functional Web Application
- A responsive, interactive web-based data visualization dashboard. - Dynamic charts, graphs, and maps (using D3.js, Chart.js, Sigma.js, or Highcharts). - Smooth user experience with filters, tooltips, zoom, and real-time updates.
Processed & Structured Data
- Optimized dataset in CSV, JSON, or database format for visualization. - Cleaned and structured data pipeline to ensure accuracy and performance.
API & Backend
- RESTful or GraphQL API to fetch real-time or large-scale data. - Secure backend using Node.js, Express, or Python (Flask/Django). - Database integration (MongoDB, PostgreSQL, Firebase, etc.).
Deployment & Hosting
- Hosted on Vercel, Netlify, AWS, or client’s preferred platform. - Fully configured domain and SSL setup for secure access.
Documentation & User Guide
- Technical documentation explaining code structure, API endpoints, and customization options. - A user guide on how to navigate the dashboard and interpret data.
Post-Deployment Support (If Included in Scope)
- Bug fixes and minor updates for an agreed period. - Training sessions for the client to manage and update the app.
Recommendations
(5.0)

Client • Mar 25, 2025
Recommended
Working with Pavel was an excellent experience. His professional skills, and unwavering dedication to the project exceeded our expectations. I’m very satisfied with his work and would gladly collaborate with him again.
Skills and tools
Industries


