
Custom Power BI Dashboard for E-CommerceAdelita Borges

You have the data. You just can't see it.
Your sales numbers live across Shopify, Google Analytics, Meta Ads, CRMs, and spreadsheets. Your team spends hours pulling reports manually, and nobody can tell you why revenue went up or down last month.
I build the system that answers that question permanently.
What you get:
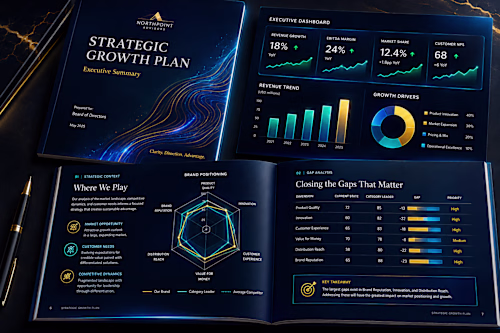
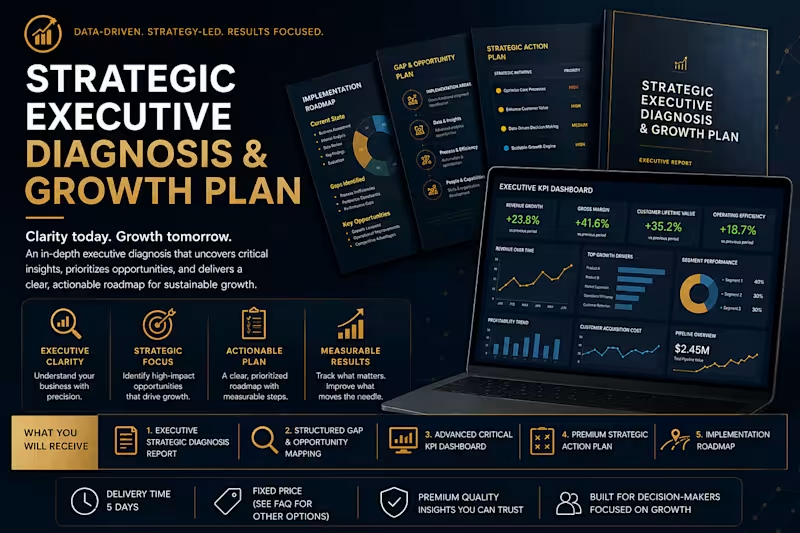
A fully functional Power BI dashboard connected to your real data sources, designed around your specific commercial flows, and ready to use on delivery day. Not a blueprint. Not a PDF. A live system your leadership team opens every morning.
What's included:
Data source mapping and connection (Shopify, GA4, Meta Ads, CRM, spreadsheets)
KPI framework designed for your business model
Executive dashboard with real-time metrics
Automated reporting logic (no more manual pulls)
Alert system for anomalies and threshold breaches
90-minute walkthrough + training session
7 days of post-delivery support
Results from past projects:
95% reduction in reporting time
8x faster report generation
R$ 12.45M revenue analyzed (+18.6% growth tracked)
30% analytical productivity gain
120 automated alerts per cycle
How it works:
Days 1-3: Strategic Immersion
I map your business context, revenue channels, data sources, and current pain points. You tell me what decisions you need the dashboard to support.
Days 4-7: Architecture & Build
I design the KPI hierarchy, connect your data sources, and build the dashboard in Power BI. Every metric is tied to a business decision.
Days 8-9: Testing & Refinement
I validate data accuracy, stress-test the alert logic, and refine visualizations based on your feedback.
Day 10: Delivery & Training
You receive the live dashboard, a 90-minute walkthrough, and documentation. Your team starts using it immediately.
This is for you if:
Your team spends more than 2 hours/week pulling reports manually
You have data in 3+ platforms but no unified view
Leadership asks questions your current reports can't answer
You've outgrown spreadsheets but haven't invested in BI yet
You need a system that works, not a strategy deck about one
FAQs
Example work

Adelita's other services

Starting at$2,000
Duration10 days
Tags
Business Intelligence
Dashboard Development
Data Visualizer
Power BI
Revenue Operations
E-Commerce Analytics
KPI Dashboard
Shopify Analytics
Service provided by
Adelita Borges Belo Horizonte, Brazil
Custom Power BI Dashboard for E-CommerceAdelita Borges
Starting at$2,000
Duration10 days
Tags
Business Intelligence
Dashboard Development
Data Visualizer
Power BI
Revenue Operations
E-Commerce Analytics
KPI Dashboard
Shopify Analytics
You have the data. You just can't see it.
Your sales numbers live across Shopify, Google Analytics, Meta Ads, CRMs, and spreadsheets. Your team spends hours pulling reports manually, and nobody can tell you why revenue went up or down last month.
I build the system that answers that question permanently.
What you get:
A fully functional Power BI dashboard connected to your real data sources, designed around your specific commercial flows, and ready to use on delivery day. Not a blueprint. Not a PDF. A live system your leadership team opens every morning.
What's included:
Data source mapping and connection (Shopify, GA4, Meta Ads, CRM, spreadsheets)
KPI framework designed for your business model
Executive dashboard with real-time metrics
Automated reporting logic (no more manual pulls)
Alert system for anomalies and threshold breaches
90-minute walkthrough + training session
7 days of post-delivery support
Results from past projects:
95% reduction in reporting time
8x faster report generation
R$ 12.45M revenue analyzed (+18.6% growth tracked)
30% analytical productivity gain
120 automated alerts per cycle
How it works:
Days 1-3: Strategic Immersion
I map your business context, revenue channels, data sources, and current pain points. You tell me what decisions you need the dashboard to support.
Days 4-7: Architecture & Build
I design the KPI hierarchy, connect your data sources, and build the dashboard in Power BI. Every metric is tied to a business decision.
Days 8-9: Testing & Refinement
I validate data accuracy, stress-test the alert logic, and refine visualizations based on your feedback.
Day 10: Delivery & Training
You receive the live dashboard, a 90-minute walkthrough, and documentation. Your team starts using it immediately.
This is for you if:
Your team spends more than 2 hours/week pulling reports manually
You have data in 3+ platforms but no unified view
Leadership asks questions your current reports can't answer
You've outgrown spreadsheets but haven't invested in BI yet
You need a system that works, not a strategy deck about one
FAQs
Example work
Adelita's other services
$2,000