
Excel DashboardJamie Tran
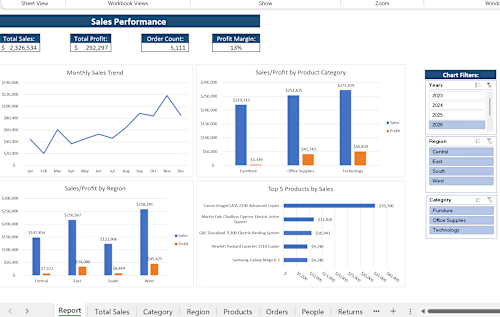
Turn your business data into a clear, easy-to-use Excel dashboard. I'll build a custom reporting workbook that brings your key metrics, trends, and performance information together in one place.
What's included:
One custom dashboard/report
Key metrics and summary reporting
Excel formulas and reporting logic as needed
PivotTables and PivotCharts where appropriate
Trends and period comparisons
Filters or slicers where appropriate
Professional formatting and layout
Up to 2 revisions
How updates work: The dashboard can update as you add or replace data in the designated source table and refresh the report. You are responsible for adding new data to the workbook.
Best for: Businesses with one primary, reasonably structured dataset that want a clear way to monitor and explore performance.
Not included: Automated importing or consolidation of recurring source files, VBA/macros, extensive data restructuring, or multiple unrelated data sources. If you want new recurring files to be automatically imported and prepared for reporting, choose Automated Excel Reporting. Revisions cover adjustments to the agreed deliverables and do not include new dashboards, new analyses, additional data sources, or expansion of the original project scope.
Not sure whether this package fits your project? Feel free to message me before purchasing. I'm happy to help determine which option best matches your needs.
FAQs
Example work
Jamie's other services
Starting at$350
Duration5 days
Tags
Dashboard Design
Microsoft Excel

Business Analyst
Business Intelligence
Data Analyst
Data Visualizer
Service provided by
Jamie Tran Boston, USA
- 3
- Followers
Excel DashboardJamie Tran
Starting at$350
Duration5 days
Tags
Dashboard Design
Microsoft Excel
Business Analyst
Business Intelligence
Data Analyst
Data Visualizer
Turn your business data into a clear, easy-to-use Excel dashboard. I'll build a custom reporting workbook that brings your key metrics, trends, and performance information together in one place.
What's included:
One custom dashboard/report
Key metrics and summary reporting
Excel formulas and reporting logic as needed
PivotTables and PivotCharts where appropriate
Trends and period comparisons
Filters or slicers where appropriate
Professional formatting and layout
Up to 2 revisions
How updates work: The dashboard can update as you add or replace data in the designated source table and refresh the report. You are responsible for adding new data to the workbook.
Best for: Businesses with one primary, reasonably structured dataset that want a clear way to monitor and explore performance.
Not included: Automated importing or consolidation of recurring source files, VBA/macros, extensive data restructuring, or multiple unrelated data sources. If you want new recurring files to be automatically imported and prepared for reporting, choose Automated Excel Reporting. Revisions cover adjustments to the agreed deliverables and do not include new dashboards, new analyses, additional data sources, or expansion of the original project scope.
Not sure whether this package fits your project? Feel free to message me before purchasing. I'm happy to help determine which option best matches your needs.
FAQs
Example work
Jamie's other services
$350