
Data Visualization with Power BI and TableauAdepeju Oladapo
As a lover of storytelling, I enjoy turning numbers and facts into fun, interactive visually appealing reports and dashboards that assist business growth.
What's included
Custom Interactive Dashboard Development
Tailored interactive dashboards created in Tableau and Power BI, presenting key insights and KPIs in an intuitive and visually appealing manner.
Data Storytelling
Compelling narratives woven into visualizations to convey complex information effectively, facilitating decision-making and strategy formulation.
Cross-Platform Compatibility
Compatibility assurance across devices and platforms, enabling seamless access and interaction with visualizations on desktops, tablets, and mobile devices.
Comprehensive Data Analysis Report
A detailed report summarizing key findings, insights, and recommendations derived from the data analysis process.
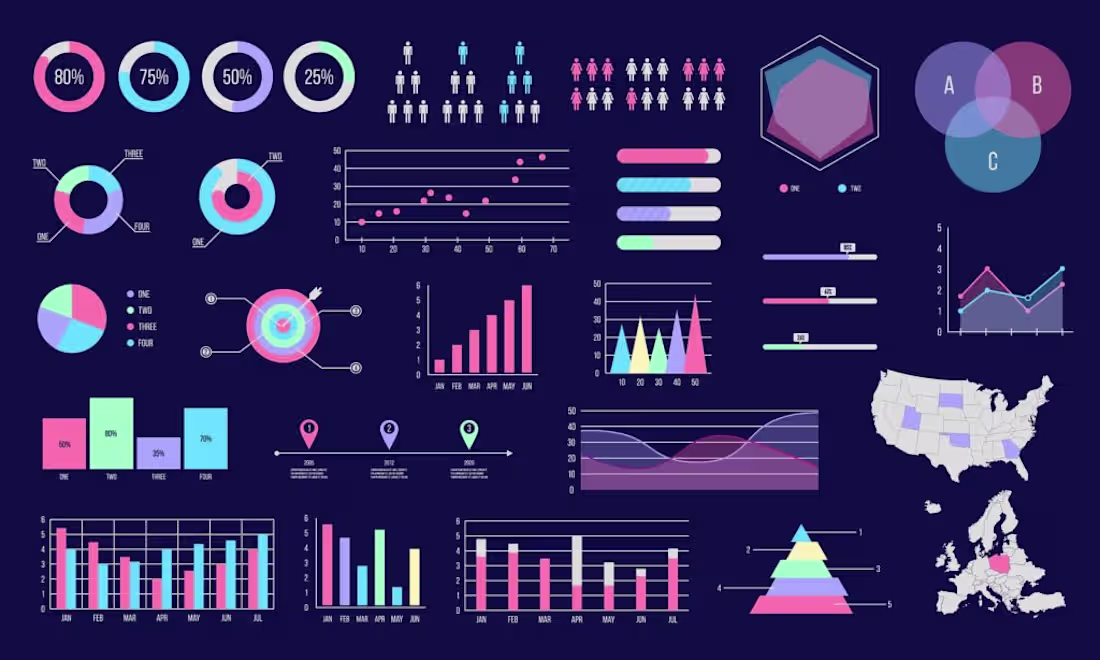
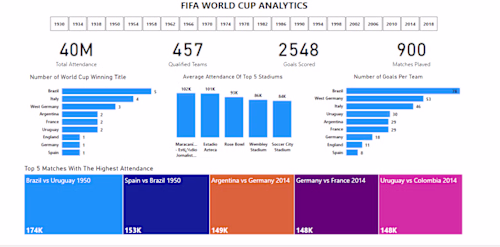
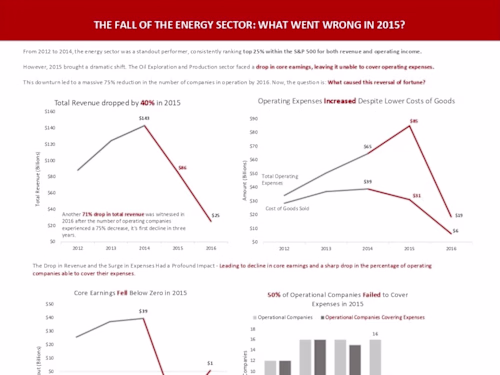
Example work


Contact for pricing
Tags
Tableau
Data Analyst
Data Scientist
Data Visualizer
Service provided by
Adepeju Oladapo Lagos, Nigeria
Data Visualization with Power BI and TableauAdepeju Oladapo
As a lover of storytelling, I enjoy turning numbers and facts into fun, interactive visually appealing reports and dashboards that assist business growth.
What's included
Custom Interactive Dashboard Development
Tailored interactive dashboards created in Tableau and Power BI, presenting key insights and KPIs in an intuitive and visually appealing manner.
Data Storytelling
Compelling narratives woven into visualizations to convey complex information effectively, facilitating decision-making and strategy formulation.
Cross-Platform Compatibility
Compatibility assurance across devices and platforms, enabling seamless access and interaction with visualizations on desktops, tablets, and mobile devices.
Comprehensive Data Analysis Report
A detailed report summarizing key findings, insights, and recommendations derived from the data analysis process.
Example work
Contact for pricing