
Animated Data Video: Bar Chart Races, Charts & KPIsGabriel Gris
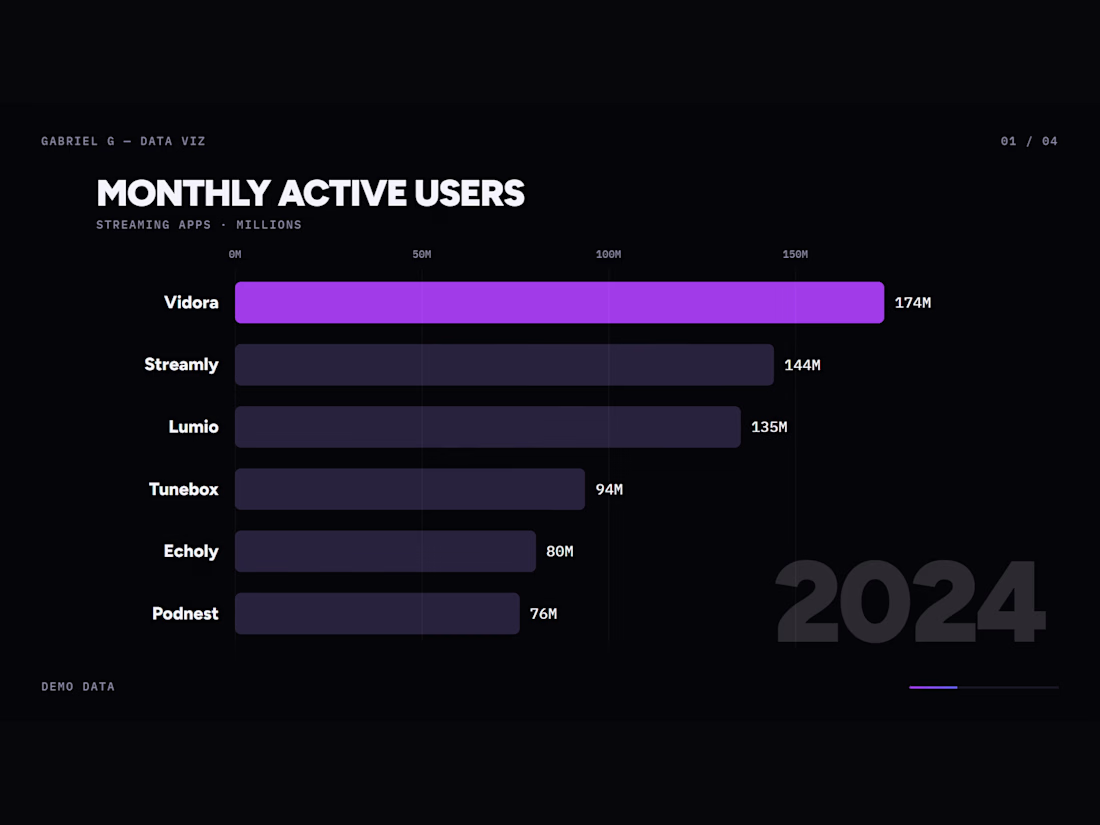
Turn your spreadsheet into a video people actually watch.
I animate your numbers into clean, modern charts: bar chart races, growth lines, KPI counters, progress rings and full data stories for YouTube, social media, pitch decks and reports. Every value on screen is computed from your file, so nothing drifts from the source.
Included: up to 4 animated charts, about 45 seconds, your brand colors and fonts, music and sound design, 16:9 or 9:16 in 1080p, two rounds of revisions. Send Excel, Google Sheets or CSV and the one message you want to show.


Starting at$150
Duration1 week
Tags
Data Visualizer
Service provided by
Gabriel Gris proElche, Spain
- 5
- Followers
Animated Data Video: Bar Chart Races, Charts & KPIsGabriel Gris
Starting at$150
Duration1 week
Tags
Data Visualizer
Turn your spreadsheet into a video people actually watch.
I animate your numbers into clean, modern charts: bar chart races, growth lines, KPI counters, progress rings and full data stories for YouTube, social media, pitch decks and reports. Every value on screen is computed from your file, so nothing drifts from the source.
Included: up to 4 animated charts, about 45 seconds, your brand colors and fonts, music and sound design, 16:9 or 9:16 in 1080p, two rounds of revisions. Send Excel, Google Sheets or CSV and the one message you want to show.
$150