
Data on the Go: Portable HTML VisualizationsJean Paul Mitterhofer
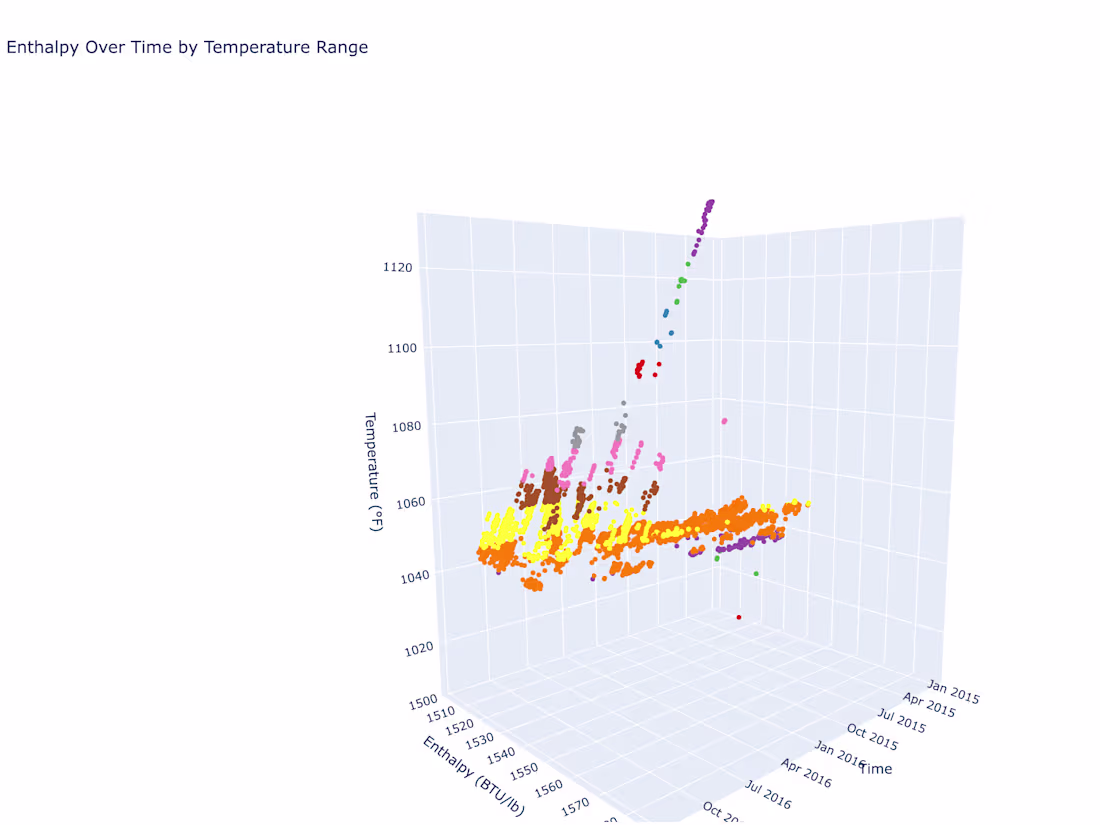
I create interactive data visualizations using Python and Plotly. These visualizations are easily accessible through a local, clickable web page( e.g. file_name.html), allowing clients to explore their data clearly and uncover hidden insights.
I go beyond the typical approach by seeking unconventional answers to data questions, ensuring a more comprehensive analysis for clients.
What's included
Plotly based HTML Visualization
Interactive Data Visualization: You'll receive a single, web-based, interactive visualization built using Python and Plotly. This means you'll get a webpage where you can click and explore your data in a clear and engaging way. Reference of visualization: https://plotly.com/python/
Jean Paul's other services

Contact for pricing
Tags
Python
Data Analyst
Data Visualizer
Service provided by
Jean Paul Mitterhofer Katy, USA
Data on the Go: Portable HTML VisualizationsJean Paul Mitterhofer
Contact for pricing
Tags
Python
Data Analyst
Data Visualizer
I create interactive data visualizations using Python and Plotly. These visualizations are easily accessible through a local, clickable web page( e.g. file_name.html), allowing clients to explore their data clearly and uncover hidden insights.
I go beyond the typical approach by seeking unconventional answers to data questions, ensuring a more comprehensive analysis for clients.
What's included
Plotly based HTML Visualization
Interactive Data Visualization: You'll receive a single, web-based, interactive visualization built using Python and Plotly. This means you'll get a webpage where you can click and explore your data in a clear and engaging way. Reference of visualization: https://plotly.com/python/
Jean Paul's other services
Contact for pricing