
AI-Powered Dashboard and Data Platform DevelopmentNivyan B
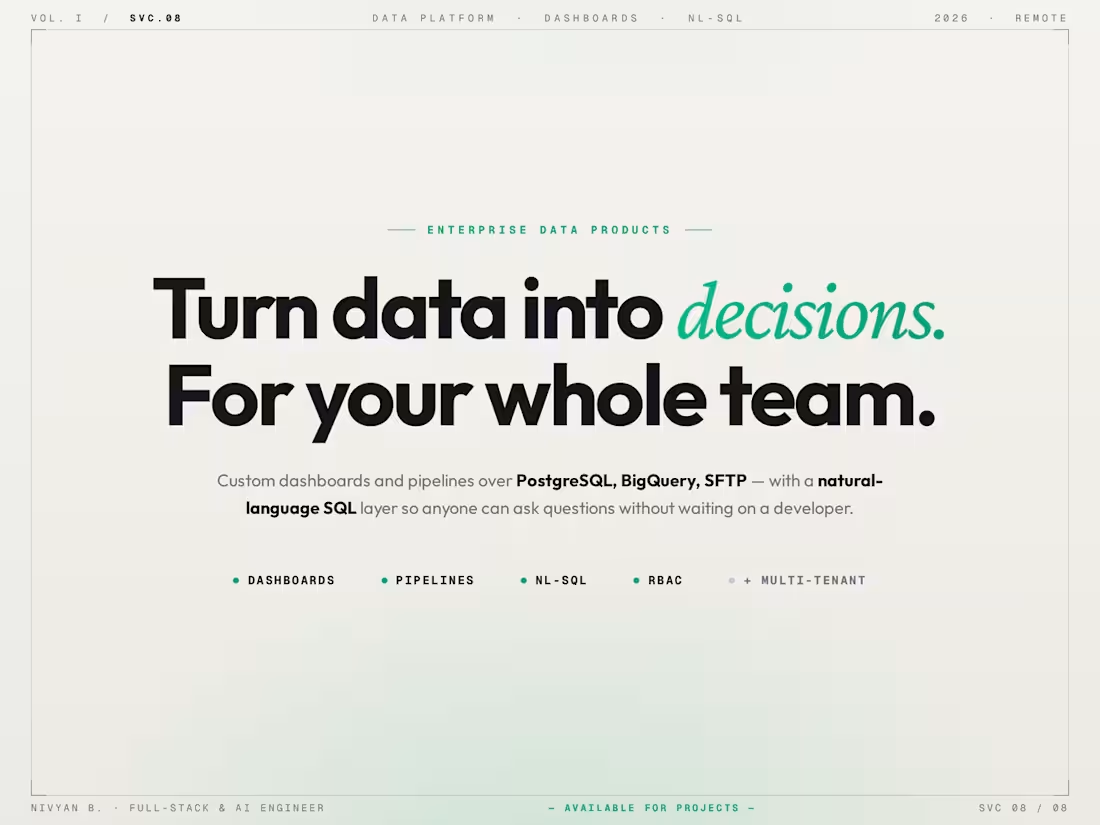
Most businesses are sitting on data they cannot actually use. It lives in databases, spreadsheets, and third-party tools, and the only people who can query it are the ones who know SQL. Everyone else is waiting on a report that is already out of date.
I build internal data platforms and analytics dashboards that give your whole team access to live, actionable insights. No more waiting on a developer to pull numbers. No more exporting CSVs and pivot-tabling your way to an answer.
I have built platforms handling 10M+ daily records from BigQuery and SFTP pipelines, real-time automotive marketplaces visualizing 7M+ vehicle records, and a natural language to SQL engine that lets non-technical users query complex databases in plain English.
If your team is making decisions based on stale data or gut feeling, this is the service that changes that.
Deliverables
Custom dashboard built to your data model and business logic
Real-time or scheduled data pipeline from your existing sources (PostgreSQL, BigQuery, REST APIs, SFTP, CSV)
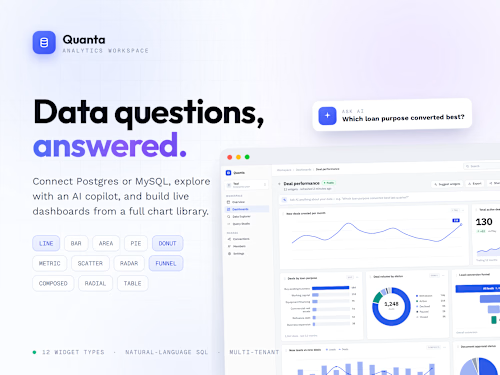
Natural language to SQL interface so non-technical users can query data without writing code
Interactive charts, tables, and widgets with filtering and drill-down capability
Multi-tenant architecture if multiple teams or clients need isolated views
Role-based access control so the right people see the right data
Deployed and live on your infrastructure or AWS
Documentation on how to add new data sources and charts going forward
My process
Discovery. I map out your existing data sources, who uses the data, and what decisions it needs to support. This shapes everything that gets built.
Data architecture. I design the pipeline and schema to make sure data flows cleanly from your sources into the dashboard layer without duplication or drift.
Core build. I start with the highest-value view first so you have something useful within the first two weeks, then layer in additional charts and features from there.
Iteration. You use it with your team and tell me what is missing or confusing. We tune the layout, filters, and queries based on real usage.
Deployment. The platform goes live on your infrastructure. I handle environment setup, credentials, and access control.
Handover. Full documentation and a Loom walkthrough so your team can add new charts and data sources without needing to come back to me.
FAQs
Starting at$45 /hr
Duration8 weeks
Tags
AWS

JavaScript

Next.js

PostgreSQL

Python

TypeScript

AI Developer
Fullstack Engineer
Software Engineer
Service provided by
Nivyan B proLahore, Pakistan
- 22
- Followers
AI-Powered Dashboard and Data Platform DevelopmentNivyan B
Starting at$45 /hr
Duration8 weeks
Tags
AWS
JavaScript
Next.js
PostgreSQL
Python
TypeScript
AI Developer
Fullstack Engineer
Software Engineer
Most businesses are sitting on data they cannot actually use. It lives in databases, spreadsheets, and third-party tools, and the only people who can query it are the ones who know SQL. Everyone else is waiting on a report that is already out of date.
I build internal data platforms and analytics dashboards that give your whole team access to live, actionable insights. No more waiting on a developer to pull numbers. No more exporting CSVs and pivot-tabling your way to an answer.
I have built platforms handling 10M+ daily records from BigQuery and SFTP pipelines, real-time automotive marketplaces visualizing 7M+ vehicle records, and a natural language to SQL engine that lets non-technical users query complex databases in plain English.
If your team is making decisions based on stale data or gut feeling, this is the service that changes that.
Deliverables
Custom dashboard built to your data model and business logic
Real-time or scheduled data pipeline from your existing sources (PostgreSQL, BigQuery, REST APIs, SFTP, CSV)
Natural language to SQL interface so non-technical users can query data without writing code
Interactive charts, tables, and widgets with filtering and drill-down capability
Multi-tenant architecture if multiple teams or clients need isolated views
Role-based access control so the right people see the right data
Deployed and live on your infrastructure or AWS
Documentation on how to add new data sources and charts going forward
My process
Discovery. I map out your existing data sources, who uses the data, and what decisions it needs to support. This shapes everything that gets built.
Data architecture. I design the pipeline and schema to make sure data flows cleanly from your sources into the dashboard layer without duplication or drift.
Core build. I start with the highest-value view first so you have something useful within the first two weeks, then layer in additional charts and features from there.
Iteration. You use it with your team and tell me what is missing or confusing. We tune the layout, filters, and queries based on real usage.
Deployment. The platform goes live on your infrastructure. I handle environment setup, credentials, and access control.
Handover. Full documentation and a Loom walkthrough so your team can add new charts and data sources without needing to come back to me.
FAQs
$45 /hr