
Data Analysis and Visualization with Excel, PPT and Power BIAashish Tiwari

I provide expert data analysis services, focusing on data cleaning, manipulation, de-duplication, and visualization. Using tools like Excel, PPT, and Power BI, I help you unlock valuable insights from your data, ensuring it is accurate, well-organized, and visually engaging.
Whether you need to prepare data for reporting, presentations, or strategic decisions, my services will deliver high-quality, actionable results.
What's included
Cleaned Data File
A thoroughly cleaned dataset with all inaccuracies, duplicates, and errors removed, ready for analysis or reporting.
Customized Data Report
A detailed report highlighting key trends and insights, generated from the cleaned and manipulated data, presented in Excel or Power BI.
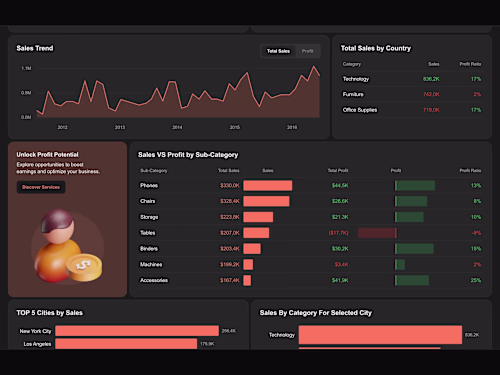
Interactive Dashboard
An interactive Power BI or Excel dashboard allowing you to explore the data, filter results, and view insights in real-time.
Presentation-Ready Visuals
Professionally designed charts, graphs, and other visual aids created in Excel or PowerPoint, ready for inclusion in reports or presentations.
FAQs
Aashish's other services
Starting at$100
Duration2 days
Tags
Microsoft Excel
Microsoft Power BI
Microsoft PowerPoint
Python
SQL
Data Analyst
Data Scientist
Data Visualizer
Service provided by
Aashish Tiwari New Delhi, India
Data Analysis and Visualization with Excel, PPT and Power BIAashish Tiwari
Starting at$100
Duration2 days
Tags
Microsoft Excel
Microsoft Power BI
Microsoft PowerPoint
Python
SQL
Data Analyst
Data Scientist
Data Visualizer
I provide expert data analysis services, focusing on data cleaning, manipulation, de-duplication, and visualization. Using tools like Excel, PPT, and Power BI, I help you unlock valuable insights from your data, ensuring it is accurate, well-organized, and visually engaging.
Whether you need to prepare data for reporting, presentations, or strategic decisions, my services will deliver high-quality, actionable results.
What's included
Cleaned Data File
A thoroughly cleaned dataset with all inaccuracies, duplicates, and errors removed, ready for analysis or reporting.
Customized Data Report
A detailed report highlighting key trends and insights, generated from the cleaned and manipulated data, presented in Excel or Power BI.
Interactive Dashboard
An interactive Power BI or Excel dashboard allowing you to explore the data, filter results, and view insights in real-time.
Presentation-Ready Visuals
Professionally designed charts, graphs, and other visual aids created in Excel or PowerPoint, ready for inclusion in reports or presentations.
FAQs
Aashish's other services
$100