
I will build an interactive data dashboard in Power BIGanesh Singh
Businesses generate a lot of data, but most of it is difficult to understand or use for decision-making. I help turn raw data into clear and interactive dashboards that show the insights that actually matter.
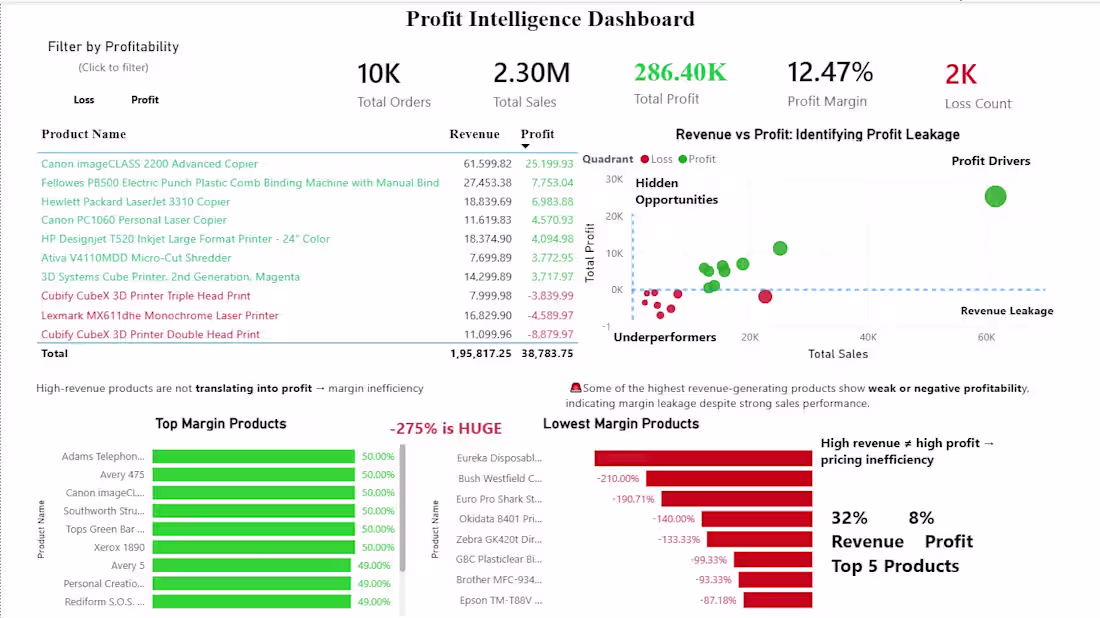
I build professional dashboards using Power BI or Excel that allow you to track performance, identify trends, and make data-driven decisions.
What I can do for you:
• Build interactive dashboards in Power BI or Excel
• Clean and transform messy data
• Connect dashboards to Excel, CSV, or SQL databases
• Create charts, KPIs, and visual reports
• Deliver dashboards that are easy to understand and ready for business use
Typical dashboards include:
• Sales performance dashboards
• Marketing analytics dashboards
• Financial reporting dashboards
• Business KPI dashboards
Tools I use:
Power BI | Excel | SQL
If you have raw data and want to turn it into meaningful insights, I can help you build a clear and professional dashboard.
FAQs
Starting at$22
Duration2 days
Tags
Microsoft Excel
Microsoft Power BI
Business Intelligence
Data Analyst
Data Visualizer
dashboard
Service provided by
Ganesh Singh Mumbai, India
- 1
- Followers
I will build an interactive data dashboard in Power BIGanesh Singh
Starting at$22
Duration2 days
Tags
Microsoft Excel
Microsoft Power BI
Business Intelligence
Data Analyst
Data Visualizer
dashboard
Businesses generate a lot of data, but most of it is difficult to understand or use for decision-making. I help turn raw data into clear and interactive dashboards that show the insights that actually matter.
I build professional dashboards using Power BI or Excel that allow you to track performance, identify trends, and make data-driven decisions.
What I can do for you:
• Build interactive dashboards in Power BI or Excel
• Clean and transform messy data
• Connect dashboards to Excel, CSV, or SQL databases
• Create charts, KPIs, and visual reports
• Deliver dashboards that are easy to understand and ready for business use
Typical dashboards include:
• Sales performance dashboards
• Marketing analytics dashboards
• Financial reporting dashboards
• Business KPI dashboards
Tools I use:
Power BI | Excel | SQL
If you have raw data and want to turn it into meaningful insights, I can help you build a clear and professional dashboard.
FAQs
$22