
Centralized Server MonitoringMirimera ✧
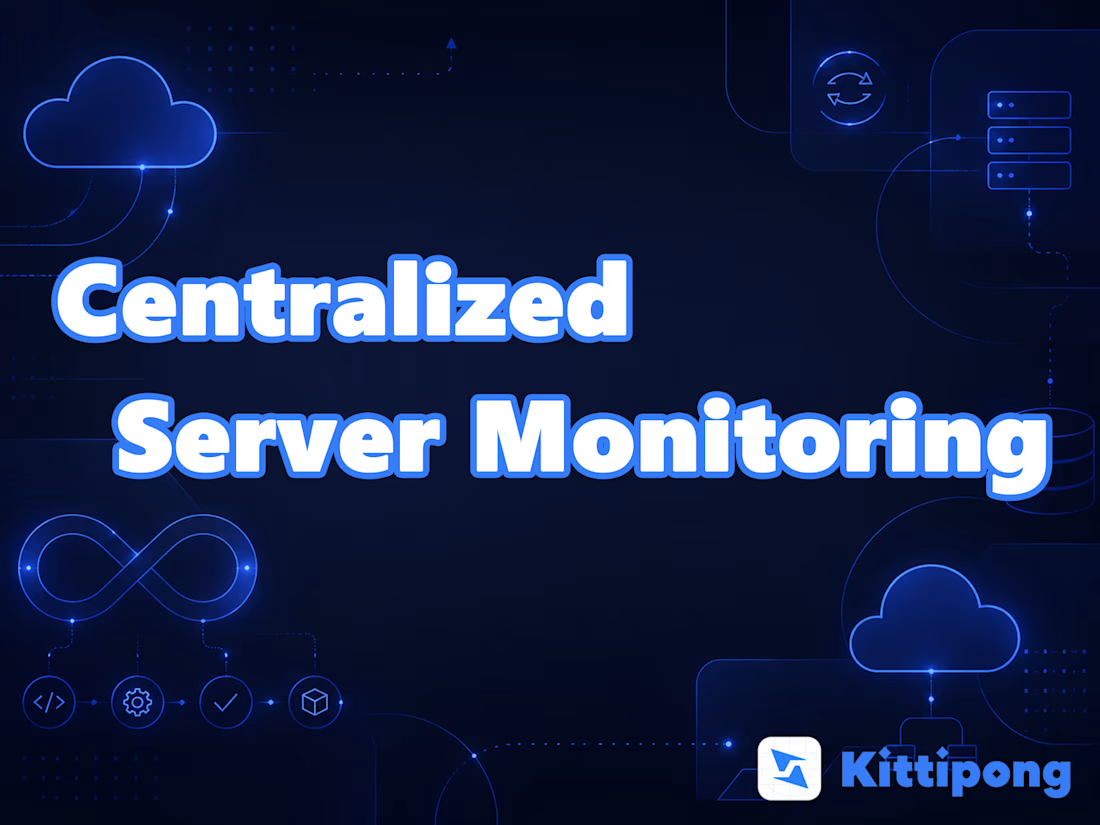
Centralized Server Monitoring
I set up a single, unified dashboard to monitor all your servers, apps, and services, so you catch problems before your users do. Instead of logging into servers one by one or finding out about outages from customer complaints, you get real-time visibility, smart alerts, and historical data all in one place.
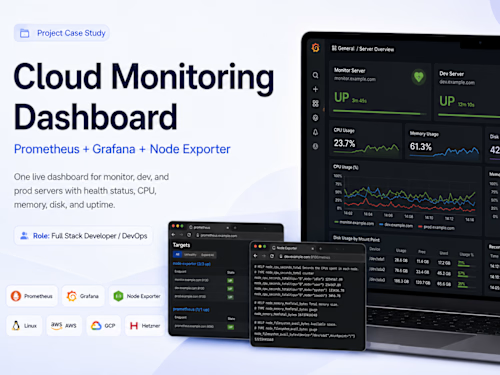
I install and configure a monitoring stack tailored to your infrastructure, tracking the metrics that matter: CPU, memory, disk, network, uptime, response times, and custom application metrics. I set up meaningful alerts (not noise) that notify your team via Slack, email, or SMS the moment something crosses a threshold, so issues get caught early. Dashboards are built to be clear and actionable, giving both engineers and non-technical stakeholders the view they need.
I also configure log aggregation so all your logs flow into one searchable place, making debugging faster, and set up uptime monitoring so you know instantly if a service goes down.
What's included:
Centralized monitoring dashboard for all servers and services
Real-time tracking of CPU, memory, disk, network, and uptime
Application and custom metric monitoring
Smart, threshold-based alerts via Slack, email, or SMS
Log aggregation and search (centralized logging)
Uptime and endpoint/health-check monitoring
Historical data and trends for capacity planning
Dashboards tuned for both technical and non-technical viewers
Documentation and handoff
Tools: Prometheus, Grafana, Datadog, Zabbix, Netdata, ELK / Loki, Uptime Kuma
Cloud & platforms: AWS, GCP, Azure, Hetzner, Contabo, on-premise, hybrid
Turnaround: Typically 1–3 weeks depending on the number of servers
Tell me how many servers and services you run, and I'll recommend a setup and send a fixed quote.
FAQs
Mirimera's other services


Starting at$35 /hr
Tags
Amazon EC2

AWS

Azure

Azure DevOps

Datadog
Google Cloud Platform

Grafana

Prometheus

DevOps Engineer
Service provided by
Mirimera ✧ Bangkok, Thailand
- $1k+
- Earned
- 2
- Paid projects
- 5.00
- Rating
- 37
- Followers
Centralized Server MonitoringMirimera ✧
Starting at$35 /hr
Tags
Amazon EC2
AWS
Azure
Azure DevOps
Datadog
Google Cloud Platform
Grafana
Prometheus
DevOps Engineer
Centralized Server Monitoring
I set up a single, unified dashboard to monitor all your servers, apps, and services, so you catch problems before your users do. Instead of logging into servers one by one or finding out about outages from customer complaints, you get real-time visibility, smart alerts, and historical data all in one place.
I install and configure a monitoring stack tailored to your infrastructure, tracking the metrics that matter: CPU, memory, disk, network, uptime, response times, and custom application metrics. I set up meaningful alerts (not noise) that notify your team via Slack, email, or SMS the moment something crosses a threshold, so issues get caught early. Dashboards are built to be clear and actionable, giving both engineers and non-technical stakeholders the view they need.
I also configure log aggregation so all your logs flow into one searchable place, making debugging faster, and set up uptime monitoring so you know instantly if a service goes down.
What's included:
Centralized monitoring dashboard for all servers and services
Real-time tracking of CPU, memory, disk, network, and uptime
Application and custom metric monitoring
Smart, threshold-based alerts via Slack, email, or SMS
Log aggregation and search (centralized logging)
Uptime and endpoint/health-check monitoring
Historical data and trends for capacity planning
Dashboards tuned for both technical and non-technical viewers
Documentation and handoff
Tools: Prometheus, Grafana, Datadog, Zabbix, Netdata, ELK / Loki, Uptime Kuma
Cloud & platforms: AWS, GCP, Azure, Hetzner, Contabo, on-premise, hybrid
Turnaround: Typically 1–3 weeks depending on the number of servers
Tell me how many servers and services you run, and I'll recommend a setup and send a fixed quote.
FAQs
Mirimera's other services
$35 /hr