
Power BI KPI Dashboards & SQL Business ReportingSyed Waqas Ur Rehman
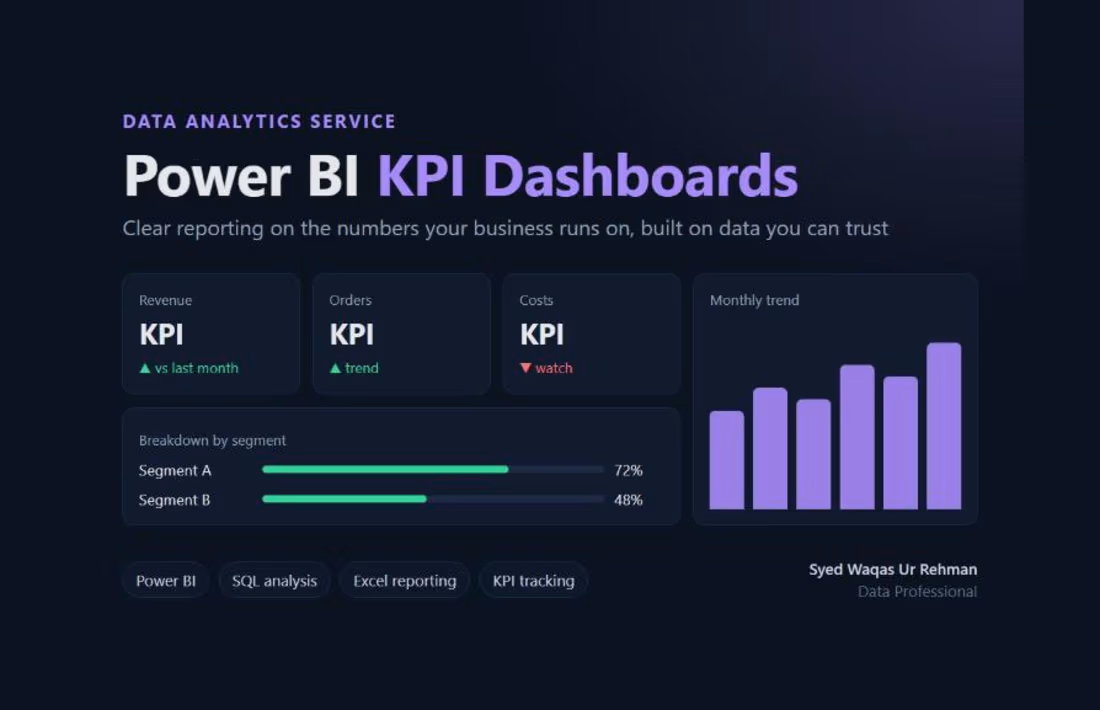
If your team spends Monday morning rebuilding last week's numbers in Excel, or nobody is sure which report is right, you don't need another spreadsheet. You need one place where the KPIs are clear and the numbers match your source systems.
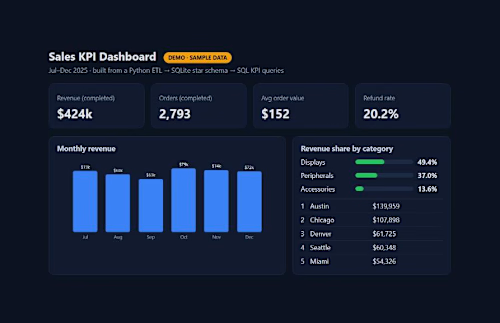
I build Power BI dashboards and SQL-based reports around the questions your business actually asks: How are sales trending? Which products, regions or customers are driving results? Where are costs or performance slipping?
Why work with me
I've built Power BI dashboards to monitor business KPIs and performance trends, written the SQL behind them (joins, CTEs, window functions), and prepared management reports that highlight gaps and support planning. I also work as a data engineer, so when the source data is messy I fix it before it reaches the dashboard instead of hiding the problem.
What I can build for you
• Power BI dashboards with KPI cards, trends, breakdowns, filters and drill-downs
• A clean data model with relationships and calculated measures
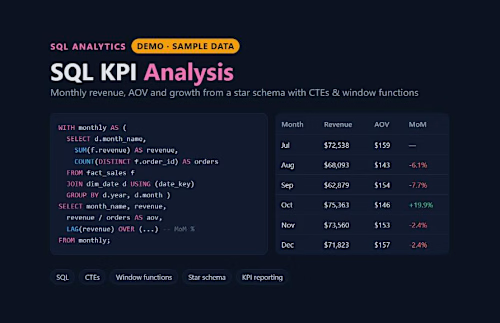
• SQL analysis: monthly KPIs, growth, top products and customers, performance gaps
• Excel reporting with Pivot Tables, XLOOKUP and Power Query
• Data cleaning and preparation so the numbers can be trusted
What you receive
• The Power BI file (.pbix), or the report published to your workspace
• Written KPI definitions, so everyone reads the numbers the same way
• The SQL queries or Power Query steps behind each figure
• A short summary of what the data shows and what is worth a closer look
• A walkthrough call so your team can use and update the dashboard
How it works
Tell me which decisions the dashboard should support and share sample data.
We agree the KPIs and page layout before I start building.
I build it, check the totals against your source data and send a draft.
You review and I refine.
What I need from you
• A data export or database access (Excel, CSV, SQL Server, PostgreSQL or MySQL)
• The KPIs you track today, even rough ones
• Power BI workspace access if the report should be published there
The starting price covers one dashboard of up to 3 pages from up to 2 data sources. Bigger reporting projects are quoted after a quick look at your data.
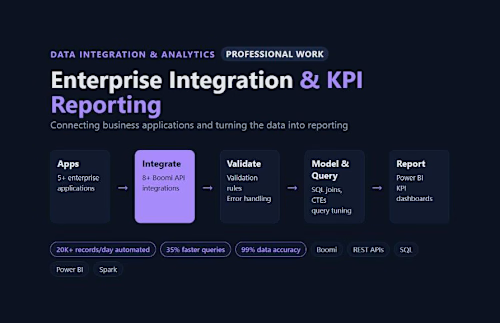
Example work
Syed Waqas Ur's other services
Starting at$100
Duration1 week
Tags
Microsoft Excel

Microsoft Power BI

SQL

Business Intelligence
Data Analyst
Data Visualizer
KPI Reporting
Power Query
Service provided by
Syed Waqas Ur Rehman Islamabad, Pakistan
Power BI KPI Dashboards & SQL Business ReportingSyed Waqas Ur Rehman
Starting at$100
Duration1 week
Tags
Microsoft Excel
Microsoft Power BI
SQL
Business Intelligence
Data Analyst
Data Visualizer
KPI Reporting
Power Query
If your team spends Monday morning rebuilding last week's numbers in Excel, or nobody is sure which report is right, you don't need another spreadsheet. You need one place where the KPIs are clear and the numbers match your source systems.
I build Power BI dashboards and SQL-based reports around the questions your business actually asks: How are sales trending? Which products, regions or customers are driving results? Where are costs or performance slipping?
Why work with me
I've built Power BI dashboards to monitor business KPIs and performance trends, written the SQL behind them (joins, CTEs, window functions), and prepared management reports that highlight gaps and support planning. I also work as a data engineer, so when the source data is messy I fix it before it reaches the dashboard instead of hiding the problem.
What I can build for you
• Power BI dashboards with KPI cards, trends, breakdowns, filters and drill-downs
• A clean data model with relationships and calculated measures
• SQL analysis: monthly KPIs, growth, top products and customers, performance gaps
• Excel reporting with Pivot Tables, XLOOKUP and Power Query
• Data cleaning and preparation so the numbers can be trusted
What you receive
• The Power BI file (.pbix), or the report published to your workspace
• Written KPI definitions, so everyone reads the numbers the same way
• The SQL queries or Power Query steps behind each figure
• A short summary of what the data shows and what is worth a closer look
• A walkthrough call so your team can use and update the dashboard
How it works
Tell me which decisions the dashboard should support and share sample data.
We agree the KPIs and page layout before I start building.
I build it, check the totals against your source data and send a draft.
You review and I refine.
What I need from you
• A data export or database access (Excel, CSV, SQL Server, PostgreSQL or MySQL)
• The KPIs you track today, even rough ones
• Power BI workspace access if the report should be published there
The starting price covers one dashboard of up to 3 pages from up to 2 data sources. Bigger reporting projects are quoted after a quick look at your data.
Example work
Syed Waqas Ur's other services
$100