
Data Analytics and Visualization using Python and PowerBIAfiq Akmal
With this service, my genuine aim is to help your business thrive through a personalized data analytics and visualization journey. I'll provide you with more than just numbers – a detailed custom report filled with insights from our analysis. The magic happens behind the scenes with Python scripts, making sure we handle your data with care and efficiency. What makes this service special is the creation of Power BI dashboards designed just for your industry, giving you an easy-to-use tool to keep an eye on what matters most. I'll also offer personalized recommendation reports and be right there with you in consultation sessions, working together to guide your decisions and improve your processes and strategies.
What's included
Customized Data Analysis Report
A detailed report outlining the findings of the data analysis, including key metrics, trends, and patterns discovered during the process.
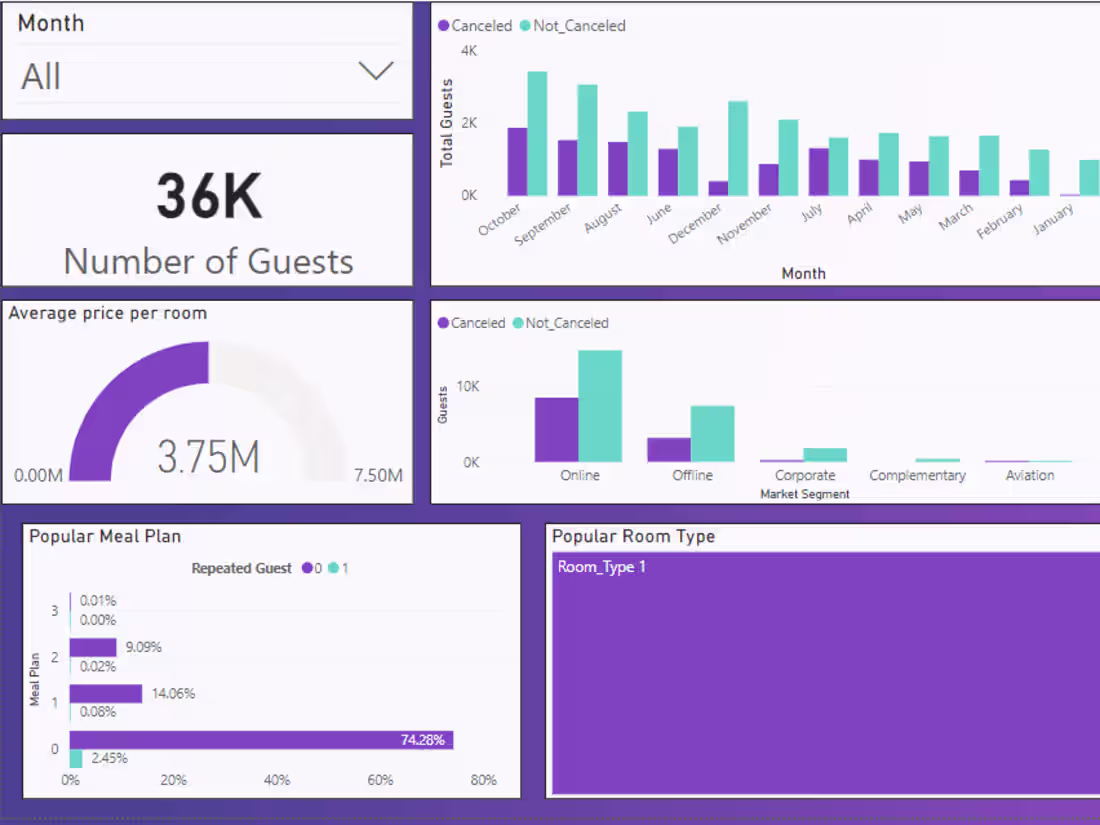
Customized Power BI dashboards
Designed specifically for industry, offering an intuitive interface for monitoring key performance indicators.
Recommendation reports based on the analysis
As a guide in making informed decisions to improve processes or strategies.
Consultation sessions (if needed)
Conduct consultation sessions to explain findings, answer queries, and discuss potential strategies based on the insights derived from the data analysis.
Afiq's other services
Starting at$100
Duration3 weeks
Tags
Microsoft Excel


Microsoft Power BI

Python

SQL

Business Analyst
Data Analyst
Data Engineer
Service provided by
Afiq Akmal Malaysia
Data Analytics and Visualization using Python and PowerBIAfiq Akmal
Starting at$100
Duration3 weeks
Tags
Microsoft Excel
Microsoft Power BI
Python
SQL
Business Analyst
Data Analyst
Data Engineer
With this service, my genuine aim is to help your business thrive through a personalized data analytics and visualization journey. I'll provide you with more than just numbers – a detailed custom report filled with insights from our analysis. The magic happens behind the scenes with Python scripts, making sure we handle your data with care and efficiency. What makes this service special is the creation of Power BI dashboards designed just for your industry, giving you an easy-to-use tool to keep an eye on what matters most. I'll also offer personalized recommendation reports and be right there with you in consultation sessions, working together to guide your decisions and improve your processes and strategies.
What's included
Customized Data Analysis Report
A detailed report outlining the findings of the data analysis, including key metrics, trends, and patterns discovered during the process.
Customized Power BI dashboards
Designed specifically for industry, offering an intuitive interface for monitoring key performance indicators.
Recommendation reports based on the analysis
As a guide in making informed decisions to improve processes or strategies.
Consultation sessions (if needed)
Conduct consultation sessions to explain findings, answer queries, and discuss potential strategies based on the insights derived from the data analysis.
Afiq's other services
$100