
Power BI Dashboard Development | KPIs, ReportsMohamed Khaled
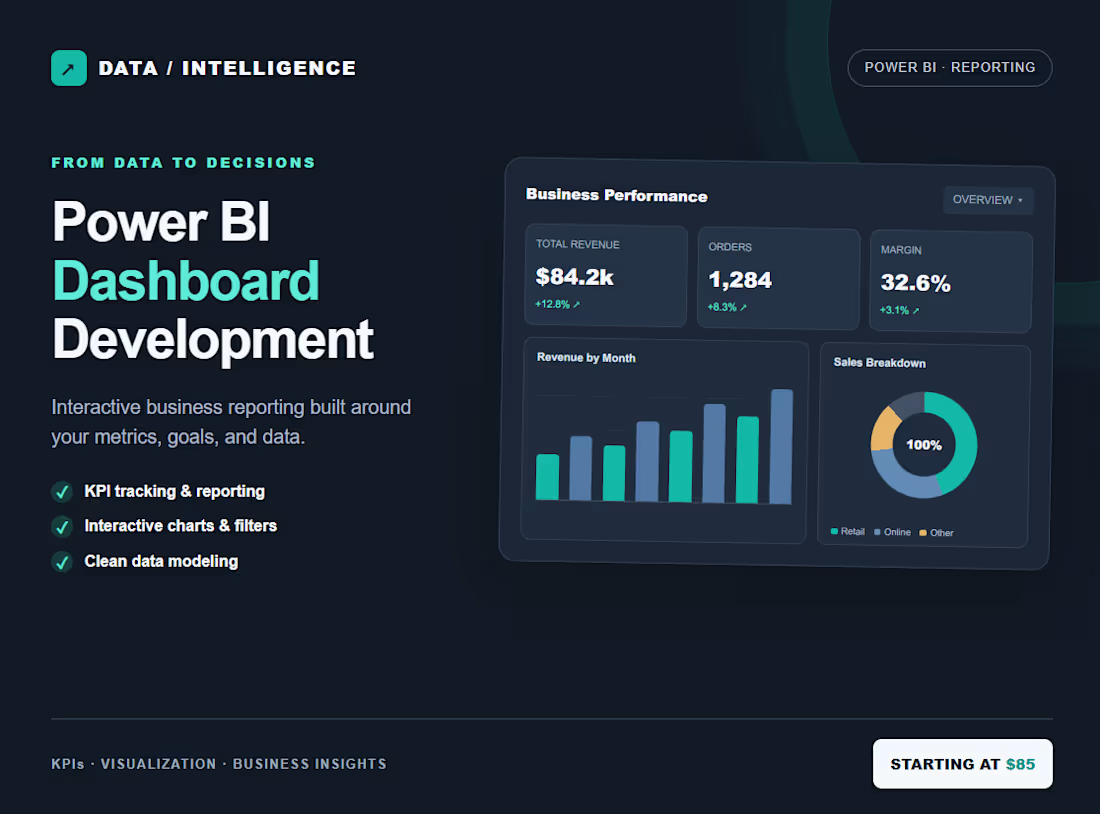
Turn Your Data Into an Interactive Power BI Dashboard
Need a clearer way to monitor business performance, track KPIs, and understand trends in your data?
I will build a clean, interactive Power BI dashboard tailored to your reporting requirements.
Rather than presenting raw tables, I focus on organizing information into useful visuals that make important metrics easier to understand.
What's included:
Data import and basic cleaning
Basic data modeling and relationships
KPI cards for agreed business metrics
Interactive charts and visualizations
Slicers and filters for exploring your data
A professional, consistent report layout
A Power BI report file (.pbix), where applicable
One revision within the original scope
Standard package:
One report page
One primary dataset, or up to three straightforward source files
Up to five agreed KPIs
Up to five charts or visuals
Four-day delivery after the data and requirements are confirmed
Possible dashboard applications include:
Sales and revenue analysis
Financial and expense reporting
Operations and performance monitoring
Customer and product analysis
Marketing performance reporting
What I need from you:
Please provide your dataset, explain the business questions you want the dashboard to answer, and identify the key metrics you want to monitor.
For multi-page reports, complex DAX calculations, advanced data transformations, database connections, or automated refresh requirements, contact me for a custom scope and quote.
My goal is to deliver a practical dashboard that helps you understand your data and make more informed decisions.
FAQs
Starting at$85
Duration5 days
Tags
Microsoft Excel

Microsoft Power BI

Python

SQL

Business Analyst
Data Analyst
Data Visualizer
Service provided by
Mohamed Khaled Damanhour, Egypt
- 1
- Followers
Power BI Dashboard Development | KPIs, ReportsMohamed Khaled
Starting at$85
Duration5 days
Tags
Microsoft Excel
Microsoft Power BI
Python
SQL
Business Analyst
Data Analyst
Data Visualizer
Turn Your Data Into an Interactive Power BI Dashboard
Need a clearer way to monitor business performance, track KPIs, and understand trends in your data?
I will build a clean, interactive Power BI dashboard tailored to your reporting requirements.
Rather than presenting raw tables, I focus on organizing information into useful visuals that make important metrics easier to understand.
What's included:
Data import and basic cleaning
Basic data modeling and relationships
KPI cards for agreed business metrics
Interactive charts and visualizations
Slicers and filters for exploring your data
A professional, consistent report layout
A Power BI report file (.pbix), where applicable
One revision within the original scope
Standard package:
One report page
One primary dataset, or up to three straightforward source files
Up to five agreed KPIs
Up to five charts or visuals
Four-day delivery after the data and requirements are confirmed
Possible dashboard applications include:
Sales and revenue analysis
Financial and expense reporting
Operations and performance monitoring
Customer and product analysis
Marketing performance reporting
What I need from you:
Please provide your dataset, explain the business questions you want the dashboard to answer, and identify the key metrics you want to monitor.
For multi-page reports, complex DAX calculations, advanced data transformations, database connections, or automated refresh requirements, contact me for a custom scope and quote.
My goal is to deliver a practical dashboard that helps you understand your data and make more informed decisions.
FAQs
$85