
Interactive Dashboards with Power BIIrfan Sajjad

Specializes in creating visually appealing and interactive dashboards that effectively communicate complex information.
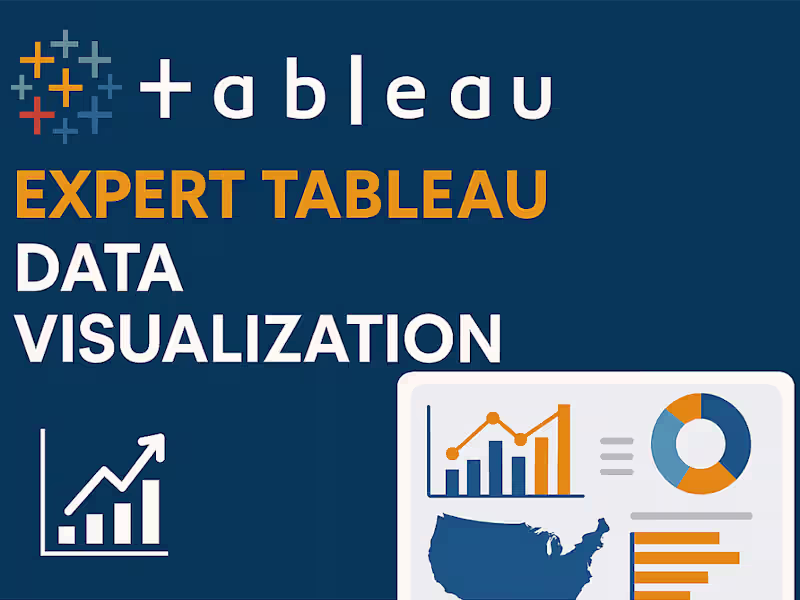
Using industry-leading tools like Power BI , transforms raw data into meaningful visualizations that enable clients to interpret trends, patterns, and correlations at a glance.
By presenting data in an intuitive way, ensures that clients can easily comprehend information for better decision-making.
What's included
Customized Data Analysis Report
A detailed report outlining the findings of the data analysis, including key metrics, trends, and patterns discovered during the process.
Customized Power BI dashboards
Designed specifically for industry, health care, human resources and sales offering an interactive interface for monitoring KPIs.
Data Integration
Data from multiple sources into the dashboard for analysis.
User friendly Interface
Ease of use for end-users.
Documentation
Documentation outlining how to use dashboard effectively.
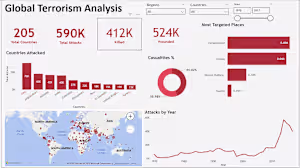
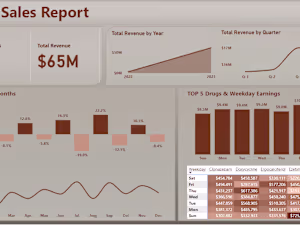
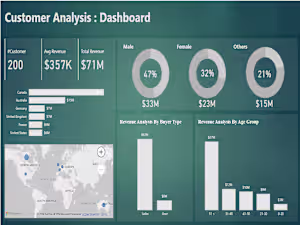
Example work


Starting at$50
Duration2 days
Tags
Microsoft Excel


Microsoft Power BI

MySQL

SQL

Data Analyst
Data Scientist
Data Visualizer
Service provided by
Irfan Sajjad Pakistan
- 22
- Followers
Interactive Dashboards with Power BIIrfan Sajjad
Starting at$50
Duration2 days
Tags
Microsoft Excel
Microsoft Power BI
MySQL
SQL
Data Analyst
Data Scientist
Data Visualizer
Specializes in creating visually appealing and interactive dashboards that effectively communicate complex information.
Using industry-leading tools like Power BI , transforms raw data into meaningful visualizations that enable clients to interpret trends, patterns, and correlations at a glance.
By presenting data in an intuitive way, ensures that clients can easily comprehend information for better decision-making.
What's included
Customized Data Analysis Report
A detailed report outlining the findings of the data analysis, including key metrics, trends, and patterns discovered during the process.
Customized Power BI dashboards
Designed specifically for industry, health care, human resources and sales offering an interactive interface for monitoring KPIs.
Data Integration
Data from multiple sources into the dashboard for analysis.
User friendly Interface
Ease of use for end-users.
Documentation
Documentation outlining how to use dashboard effectively.
Example work
$50