
Interactive KPI Dashboard in Looker Studio or Power BIIbanga Ibanga
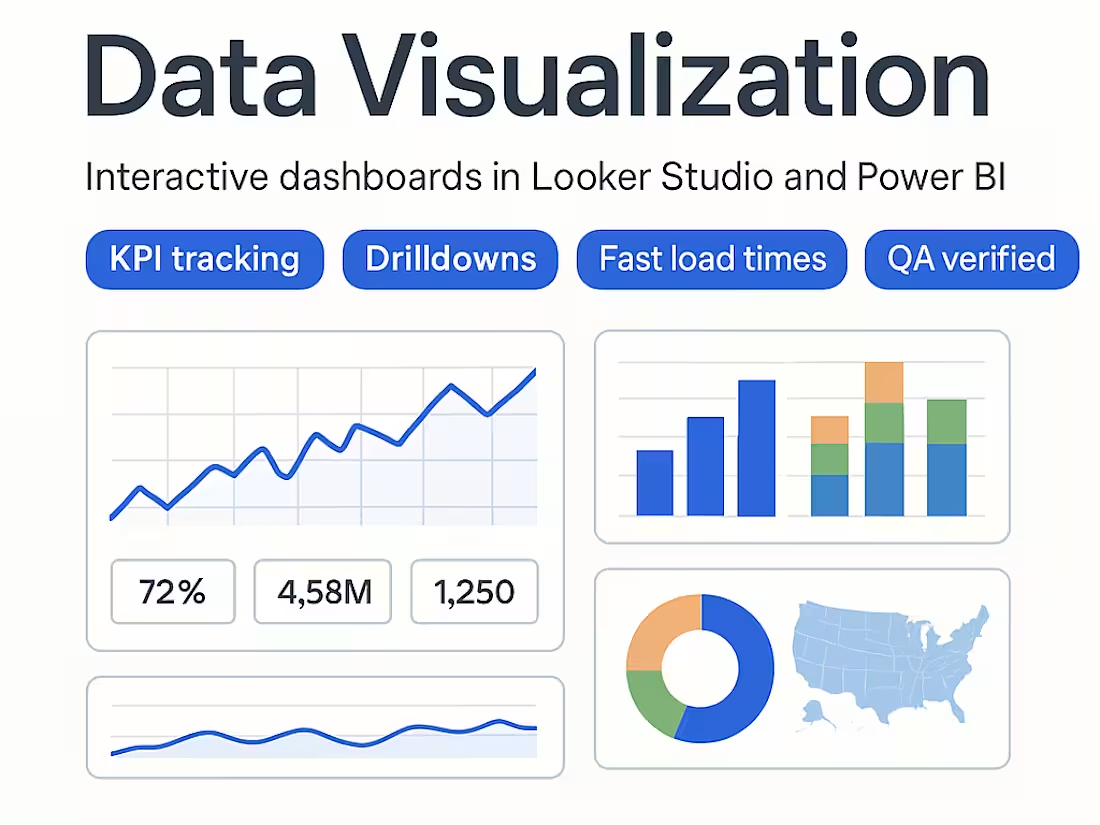
I design an interactive dashboard your team can use every day. You get clean data connections, a documented KPI dictionary, and a fast, reliable report in Looker Studio or Power BI. The result is clear visibility for weekly and monthly decisions. Typical delivery is 7 to 12 business days after access.
What's included
Requirements and wireframe brief
One page PDF. Lists goals, users, KPIs, pages, and filters. Includes one low-fidelity wireframe per page, up to three pages. One revision before build.
Data connections and model
Secure connectors to GA4, Ads, Sheets, CSV, or database. One standardized data model delivered as BigQuery views or a Power BI dataset. One revision.
Interactive dashboard
One dashboard in Looker Studio or Power BI. Up to three pages with 15 to 25 visuals, date and category filters, and basic drilldowns. Mobile friendly layout where possible. Two revision rounds within 14 days.
KPI dictionary
One Google Sheet that defines KPIs and dimensions. Includes exact formulas, filters, and notes. One revision to align with stakeholder feedback.
QA report, handover, and walkthrough
One QA report that confirms totals and trends. One 10 to 20 minute Loom video. One access guide PDF with viewer and editor steps. Zipped folder with links and source files. Minor access fixes for 7 days.
FAQs
Ibanga's other services
Starting at$600
Duration1 week
Tags
Looker Studio
Microsoft Power BI
Tableau
Data Analyst
Data Scientist
Data Visualizer
Service provided by
Ibanga Ibanga Lagos, Nigeria
Interactive KPI Dashboard in Looker Studio or Power BIIbanga Ibanga
Starting at$600
Duration1 week
Tags
Looker Studio
Microsoft Power BI
Tableau
Data Analyst
Data Scientist
Data Visualizer
I design an interactive dashboard your team can use every day. You get clean data connections, a documented KPI dictionary, and a fast, reliable report in Looker Studio or Power BI. The result is clear visibility for weekly and monthly decisions. Typical delivery is 7 to 12 business days after access.
What's included
Requirements and wireframe brief
One page PDF. Lists goals, users, KPIs, pages, and filters. Includes one low-fidelity wireframe per page, up to three pages. One revision before build.
Data connections and model
Secure connectors to GA4, Ads, Sheets, CSV, or database. One standardized data model delivered as BigQuery views or a Power BI dataset. One revision.
Interactive dashboard
One dashboard in Looker Studio or Power BI. Up to three pages with 15 to 25 visuals, date and category filters, and basic drilldowns. Mobile friendly layout where possible. Two revision rounds within 14 days.
KPI dictionary
One Google Sheet that defines KPIs and dimensions. Includes exact formulas, filters, and notes. One revision to align with stakeholder feedback.
QA report, handover, and walkthrough
One QA report that confirms totals and trends. One 10 to 20 minute Loom video. One access guide PDF with viewer and editor steps. Zipped folder with links and source files. Minor access fixes for 7 days.
FAQs
Ibanga's other services
$600