
Analytics & Dashboard DesignMaria Garsel
When your data lives in different spreadsheets and systems,
it becomes almost impossible to get a clean, reliable view of what’s actually happening. This service brings everything into one structured reporting system, so you can see your numbers without digging, stitching, or guessing.
I build dashboards around the real questions operators need
answered every day:
How are we performing
Where margins are shifting
What’s happening with cash
What’s driving changes in revenue or efficiency
The goal is simple: a clear, dependable view of your
business so decisions become faster and more confident.
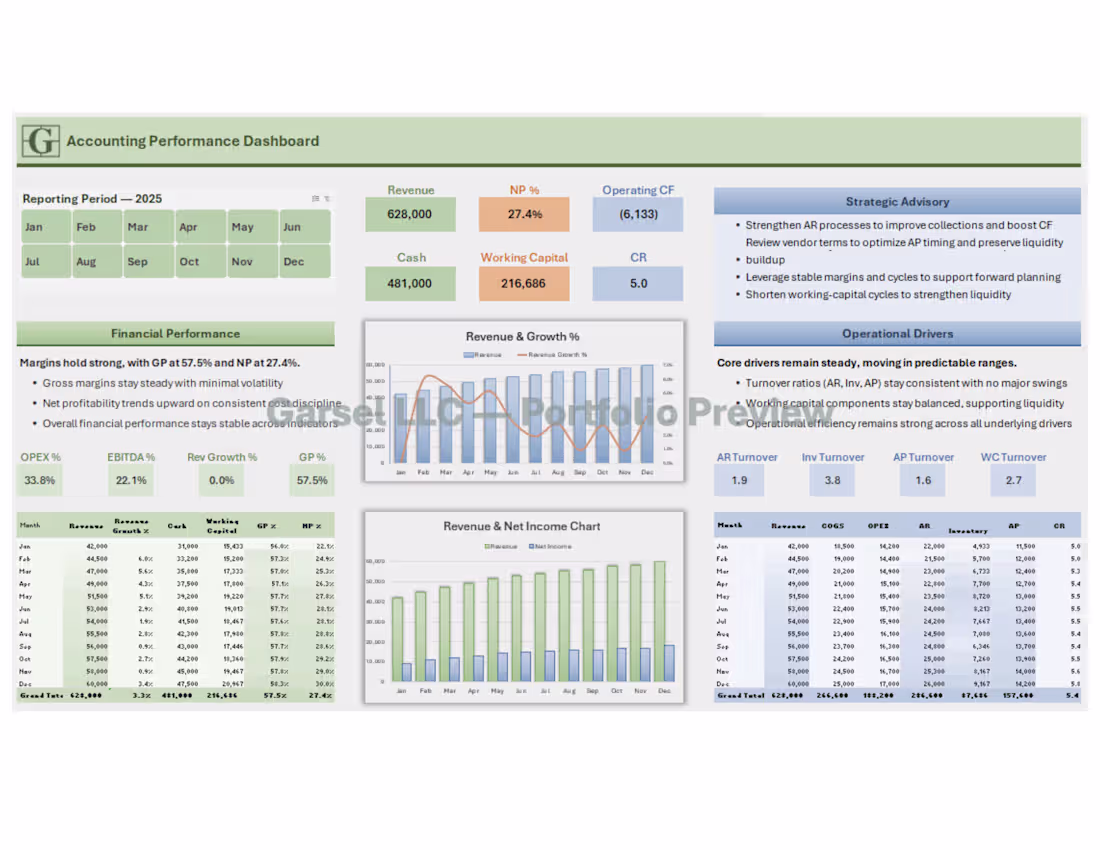
I organize your data, define the right metrics, and build
dashboards that are clean, tailored, and easy for your team to use. You end up with a reporting system that shows what’s working, what needs attention, and where to focus next.
This service is best for:
Businesses needing visibility into revenue, margins, cash
flow, or operational drivers
Teams working across multiple spreadsheets or disconnected systems
Organizations that want a consistent reporting structure without unnecessary complexity
What you receive:
A clean, tailored Excel dashboard
KPIs aligned to your business model
Automated tables and period‑over‑period comparisons
Revenue, margin, cash flow, and operational driver views
A clear guide to the dashboard’s structure and logic -
delivered as a live walkthrough, a written explanation, or whatever format works best for your team
Maria's other services
Starting at$800
Duration1 week
Tags
Business Analyst
Business Operations
Data Analyst
Financial Analyst
Operations Analyst
Reporting
Service provided by
Maria Garsel San Diego, USA
Analytics & Dashboard DesignMaria Garsel
Starting at$800
Duration1 week
Tags
Business Analyst
Business Operations
Data Analyst
Financial Analyst
Operations Analyst
Reporting
When your data lives in different spreadsheets and systems,
it becomes almost impossible to get a clean, reliable view of what’s actually happening. This service brings everything into one structured reporting system, so you can see your numbers without digging, stitching, or guessing.
I build dashboards around the real questions operators need
answered every day:
How are we performing
Where margins are shifting
What’s happening with cash
What’s driving changes in revenue or efficiency
The goal is simple: a clear, dependable view of your
business so decisions become faster and more confident.
I organize your data, define the right metrics, and build
dashboards that are clean, tailored, and easy for your team to use. You end up with a reporting system that shows what’s working, what needs attention, and where to focus next.
This service is best for:
Businesses needing visibility into revenue, margins, cash
flow, or operational drivers
Teams working across multiple spreadsheets or disconnected systems
Organizations that want a consistent reporting structure without unnecessary complexity
What you receive:
A clean, tailored Excel dashboard
KPIs aligned to your business model
Automated tables and period‑over‑period comparisons
Revenue, margin, cash flow, and operational driver views
A clear guide to the dashboard’s structure and logic -
delivered as a live walkthrough, a written explanation, or whatever format works best for your team
Maria's other services
$800