
Hospital Operations & Revenue Leakage AnalysisMwanahamisi Juma
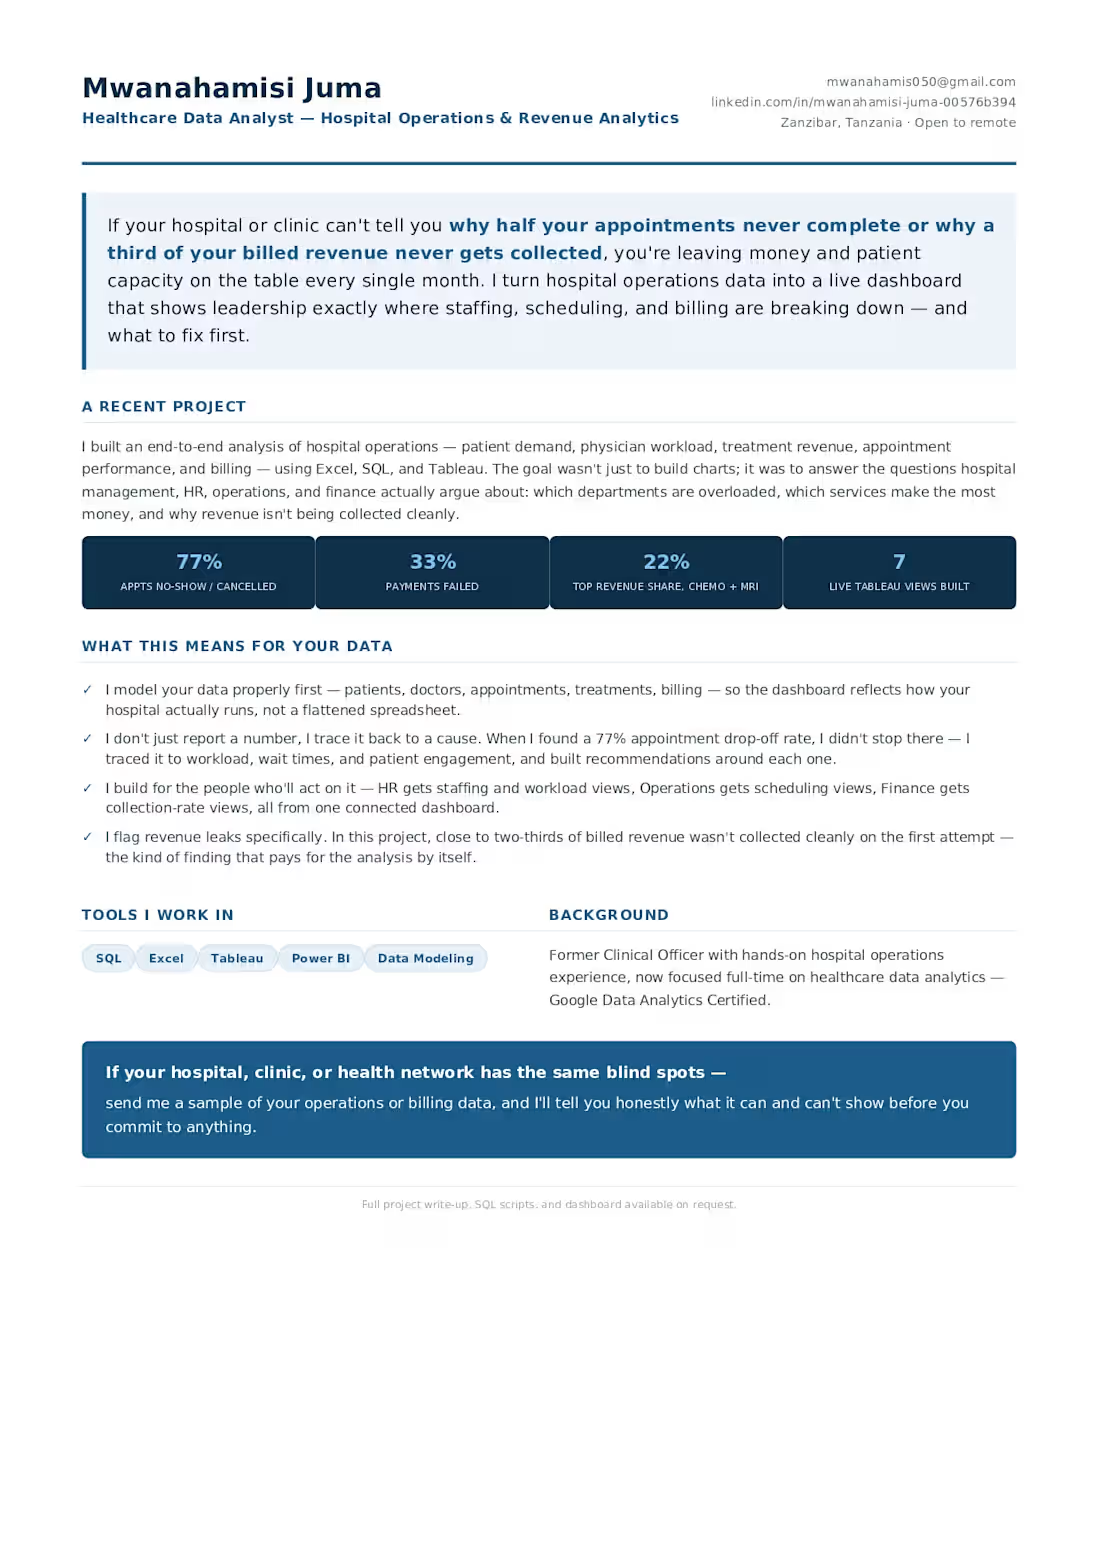
Hospitals lose money in ways that don't always show up until someone actually looks — missed appointments, failed payments, scheduling gaps. I dig into operational data using SQL and build dashboards in Tableau that show exactly where and how much is leaking, so HR, Operations, and Finance teams can see it in one place instead of chasing numbers across different spreadsheets.
In one project, this kind of analysis found that only 23% of appointments were actually completed — the rest were no-shows or cancellations — and that only 32% of billed revenue was cleanly collected, with the remainder split between pending and failed payments. It also showed that Chemotherapy and MRI services were the top revenue drivers, which changes how you'd prioritize fixing the leaks.
What you get: a cleaned dataset, a clear picture of where revenue is being lost, and an interactive Tableau dashboard your team can check anytime — not a one-off static report."
Mwanahamisi's other services
Starting at$250
Duration1 day
Tags
SQL

Tableau

healthcare data analysis
hospital operations
Revenue analysis
Service provided by
Mwanahamisi Juma Dar es Salaam, Tanzania
Hospital Operations & Revenue Leakage AnalysisMwanahamisi Juma
Starting at$250
Duration1 day
Tags
SQL
Tableau
healthcare data analysis
hospital operations
Revenue analysis
Hospitals lose money in ways that don't always show up until someone actually looks — missed appointments, failed payments, scheduling gaps. I dig into operational data using SQL and build dashboards in Tableau that show exactly where and how much is leaking, so HR, Operations, and Finance teams can see it in one place instead of chasing numbers across different spreadsheets.
In one project, this kind of analysis found that only 23% of appointments were actually completed — the rest were no-shows or cancellations — and that only 32% of billed revenue was cleanly collected, with the remainder split between pending and failed payments. It also showed that Chemotherapy and MRI services were the top revenue drivers, which changes how you'd prioritize fixing the leaks.
What you get: a cleaned dataset, a clear picture of where revenue is being lost, and an interactive Tableau dashboard your team can check anytime — not a one-off static report."
Mwanahamisi's other services
$250