
Build dynamic and interactive visualizations for insightsAditya Tanwar
I specialize in transforming complex data into clear, actionable insights through intuitive visual storytelling. Whether you're looking to track KPIs, analyze trends, or present your data in an engaging way. I have good command over several tools and technologies required to do the same:
1. Proficient with using Python (Pandas, Numpy, Matplotlib) for data cleaning and managing unorganized data.
2. SQL and SQL servers for manipulation of data and Exploratory Data Analysis to derive valuable insights, also can be used for modeling.
3. Experienced with using visualizations tools such as Power BI and Tableau to present a clean and easy to understand report for the data.
What's included
Dynamic Dashboard
Tailored to your specific needs, whether you're tracking KPIs, sales performance, or customer behavior.
Dynamic and Animated Visuals
Engaging, interactive dashboards that bring your data to life and make it easy to spot trends and patterns.
Complementary Presentations
I will provide a professionally designed presentation to showcase your data insights, perfect for stakeholders and team meetings.
FAQs
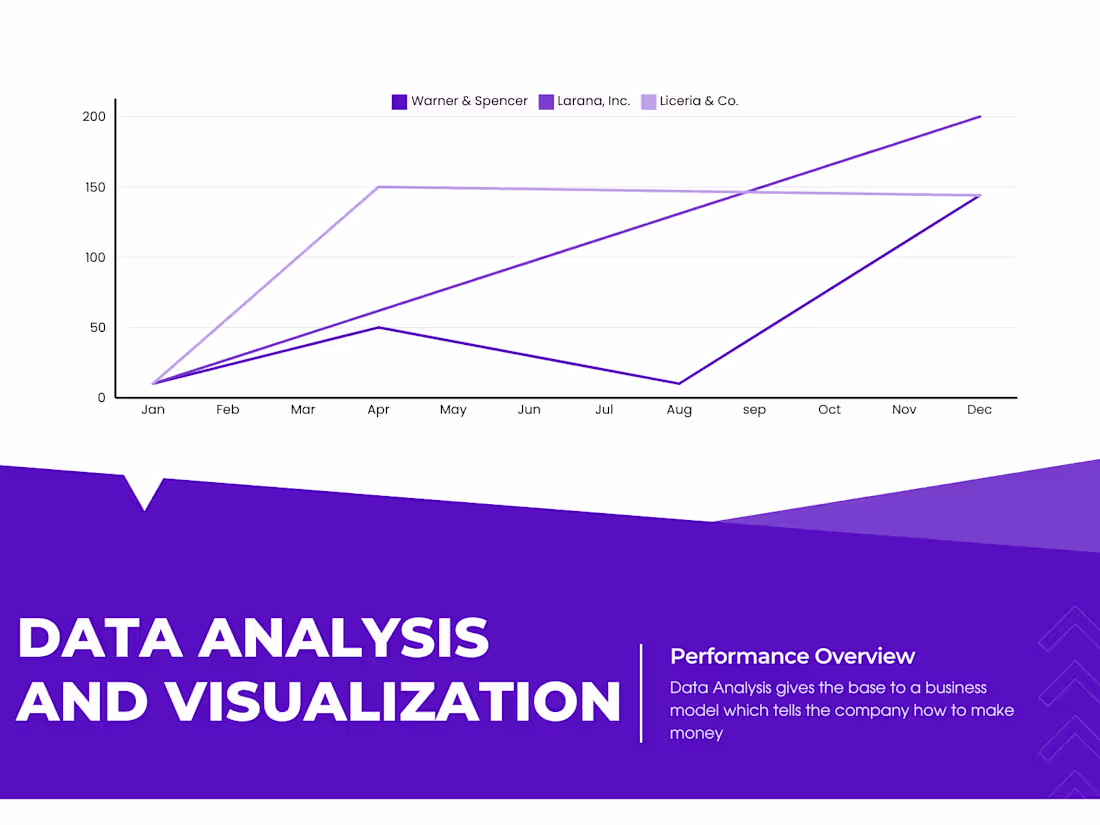
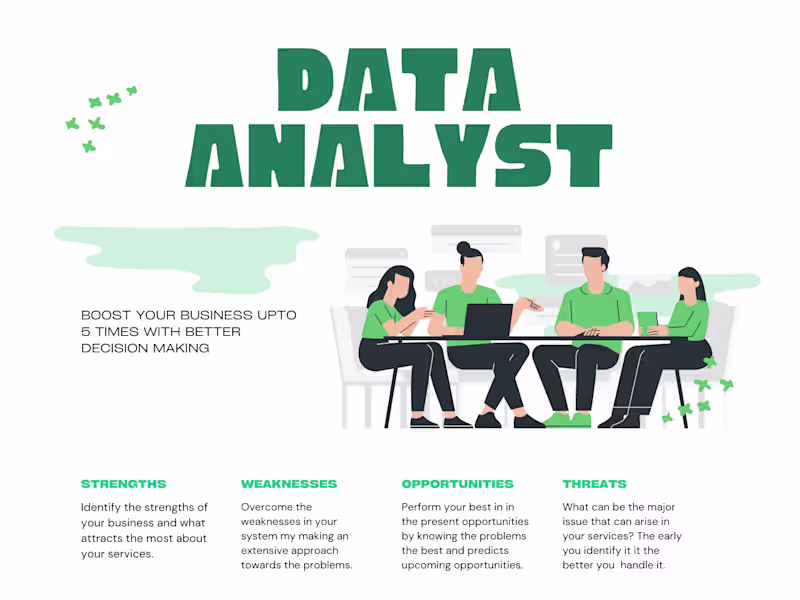
Example work


Aditya's other services
Starting at$29 /hr
Tags
Matplotlib
Microsoft Power BI
Microsoft PowerPoint
pandas
Tableau
Data Analyst
Data Visualizer
Presentation Designer
Service provided by
Aditya Tanwar Faridabad, India
Build dynamic and interactive visualizations for insightsAditya Tanwar
Starting at$29 /hr
Tags
Matplotlib
Microsoft Power BI
Microsoft PowerPoint
pandas
Tableau
Data Analyst
Data Visualizer
Presentation Designer
I specialize in transforming complex data into clear, actionable insights through intuitive visual storytelling. Whether you're looking to track KPIs, analyze trends, or present your data in an engaging way. I have good command over several tools and technologies required to do the same:
1. Proficient with using Python (Pandas, Numpy, Matplotlib) for data cleaning and managing unorganized data.
2. SQL and SQL servers for manipulation of data and Exploratory Data Analysis to derive valuable insights, also can be used for modeling.
3. Experienced with using visualizations tools such as Power BI and Tableau to present a clean and easy to understand report for the data.
What's included
Dynamic Dashboard
Tailored to your specific needs, whether you're tracking KPIs, sales performance, or customer behavior.
Dynamic and Animated Visuals
Engaging, interactive dashboards that bring your data to life and make it easy to spot trends and patterns.
Complementary Presentations
I will provide a professionally designed presentation to showcase your data insights, perfect for stakeholders and team meetings.
FAQs
Example work
Aditya's other services
$29 /hr