
Data analysis with python nuor Killny
The Data Analysis with Python service helps process, analyze, and visualize data using Python libraries like Pandas, NumPy, and Matplotlib. It includes data cleaning, exploratory analysis, statistical modeling, and predictive analytics. The service enables users to uncover insights, trends, and patterns in data, making it easier to make data-driven decisions and improve business or research outcomes.
What's included
Data Analysis with Python: Comprehensive Deliverables and Insights
Upon completion of the Data Analysis with Python service, the following deliverables will be provided:
1. Data Preprocessing and Cleaning Report
A detailed report outlining the steps taken to clean and preprocess the provided dataset, including handling missing values, removing outliers, data transformation, and feature engineering (if applicable).
2. Exploratory Data Analysis (EDA)
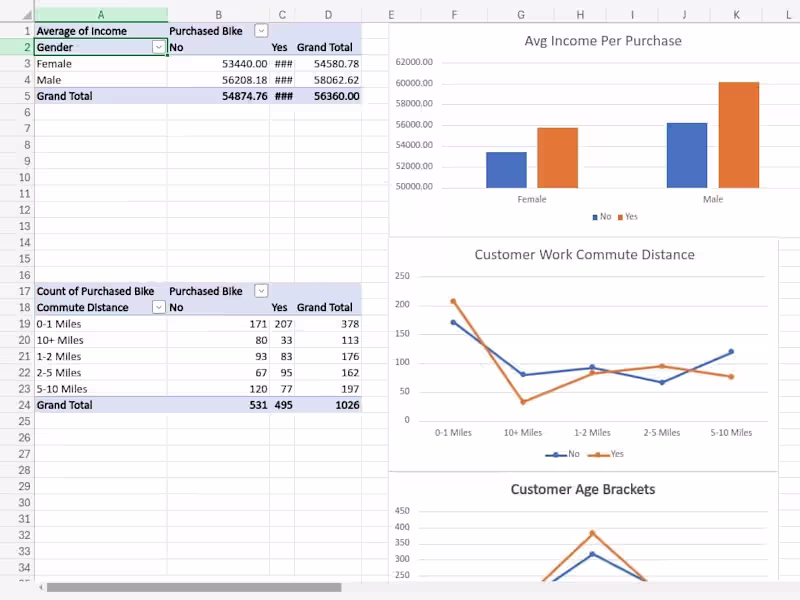
A comprehensive EDA report with visualizations (charts, graphs, and plots) that provide insights into the data’s structure, trends, correlations, and patterns. This may include:
Summary statistics
Distribution analysis
Correlation matrices
Data visualizations (e.g., histograms, boxplots, scatter plots)
4. Python Code and Scripts
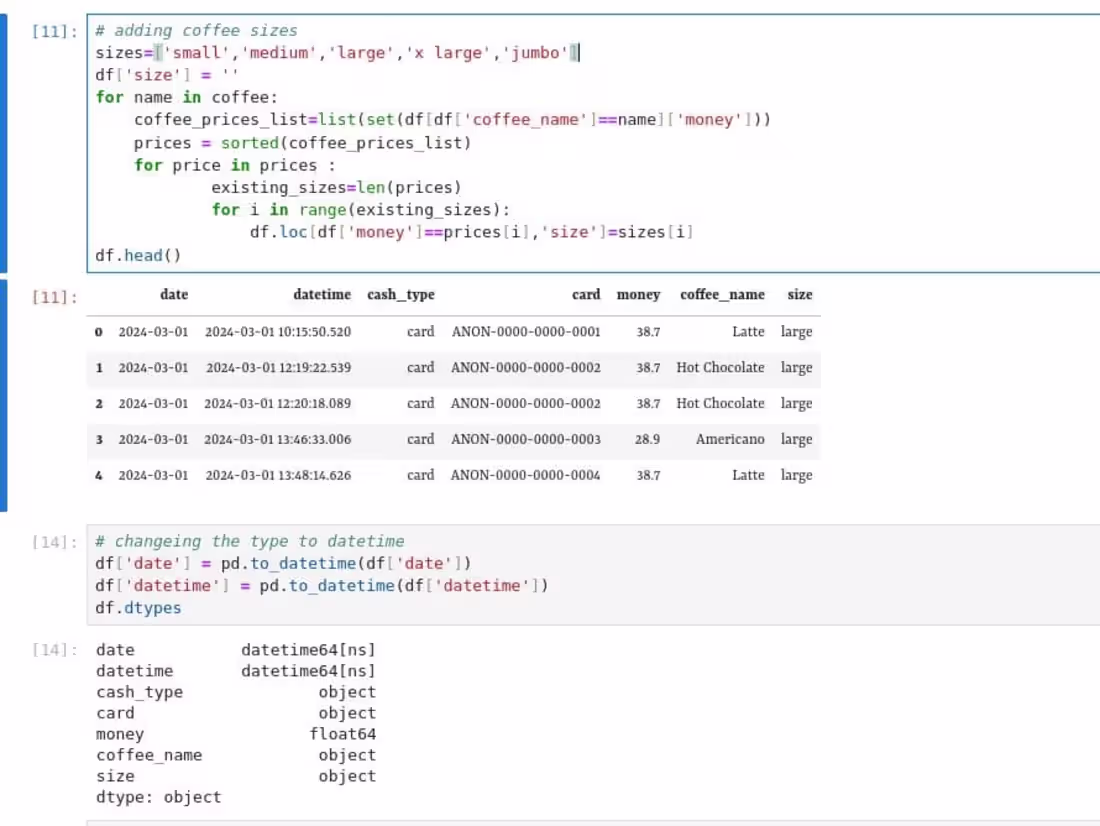
Well-documented Python code used for data cleaning, analysis, modeling, and visualization. Code will be provided in a modular format, with clear comments explaining the logic and steps, ensuring it is reproducible for future use.
5. Final Report and Insights
A final report summarizing the findings from the data analysis and modeling process. This report will include:
Key insights and trends discovered
Business recommendations based on the analysis
Visualizations to support findings
Any potential next steps for further analysis or model improvement
6. Jupyter Notebooks/Interactive Notebooks
Interactive Jupyter Notebooks with the complete analysis process documented and visualized, making it easy for clients to interact with the data and models, and gain additional insights.
8. Post-Delivery Support
A one-time follow-up for addressing any questions or clarifications regarding the analysis, code, or deliverables
nuor's other services
Contact for pricing
Tags
Matplotlib
pandas
Python
Data Modelling Analyst
Service provided by
nuor Killny Giza, Egypt
Data analysis with python nuor Killny
Contact for pricing
Tags
Matplotlib
pandas
Python
Data Modelling Analyst
The Data Analysis with Python service helps process, analyze, and visualize data using Python libraries like Pandas, NumPy, and Matplotlib. It includes data cleaning, exploratory analysis, statistical modeling, and predictive analytics. The service enables users to uncover insights, trends, and patterns in data, making it easier to make data-driven decisions and improve business or research outcomes.
What's included
Data Analysis with Python: Comprehensive Deliverables and Insights
Upon completion of the Data Analysis with Python service, the following deliverables will be provided:
1. Data Preprocessing and Cleaning Report
A detailed report outlining the steps taken to clean and preprocess the provided dataset, including handling missing values, removing outliers, data transformation, and feature engineering (if applicable).
2. Exploratory Data Analysis (EDA)
A comprehensive EDA report with visualizations (charts, graphs, and plots) that provide insights into the data’s structure, trends, correlations, and patterns. This may include:
Summary statistics
Distribution analysis
Correlation matrices
Data visualizations (e.g., histograms, boxplots, scatter plots)
4. Python Code and Scripts
Well-documented Python code used for data cleaning, analysis, modeling, and visualization. Code will be provided in a modular format, with clear comments explaining the logic and steps, ensuring it is reproducible for future use.
5. Final Report and Insights
A final report summarizing the findings from the data analysis and modeling process. This report will include:
Key insights and trends discovered
Business recommendations based on the analysis
Visualizations to support findings
Any potential next steps for further analysis or model improvement
6. Jupyter Notebooks/Interactive Notebooks
Interactive Jupyter Notebooks with the complete analysis process documented and visualized, making it easy for clients to interact with the data and models, and gain additional insights.
8. Post-Delivery Support
A one-time follow-up for addressing any questions or clarifications regarding the analysis, code, or deliverables
nuor's other services
Contact for pricing