
Data analysis with excelnuor Killny
Data analysis with Excel involves importing, cleaning, and organizing data to derive insights. Key steps include using formulas (e.g., SUM, AVERAGE), creating pivot tables, and applying statistical functions (mean, median, regression). Excel also offers tools for data visualization, such as charts and graphs, and automating tasks with macros. It’s a powerful tool for both simple and advanced data analysis, widely used in business, finance, and research.
What's included
Comprehensive Data Analysis and Reporting using Excel
1. Data Collection and Preparation:
Gather raw data provided by the client or sourced from relevant databases.
Clean and format the data, ensuring consistency, accuracy, and completeness for analysis.
Perform initial data validation to identify and resolve discrepancies or errors.
2. Data Analysis and Visualization:
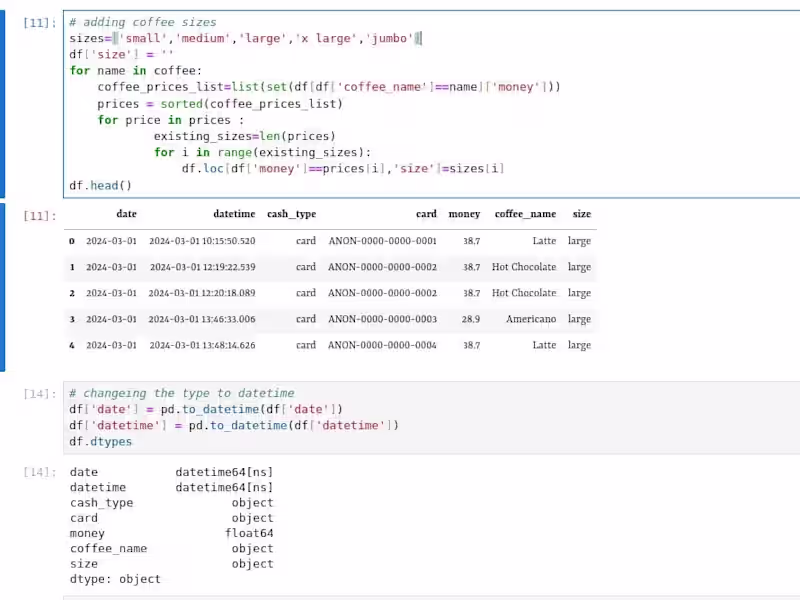
Use Excel tools (such as PivotTables, Power Query, and formulas) to analyze the data.
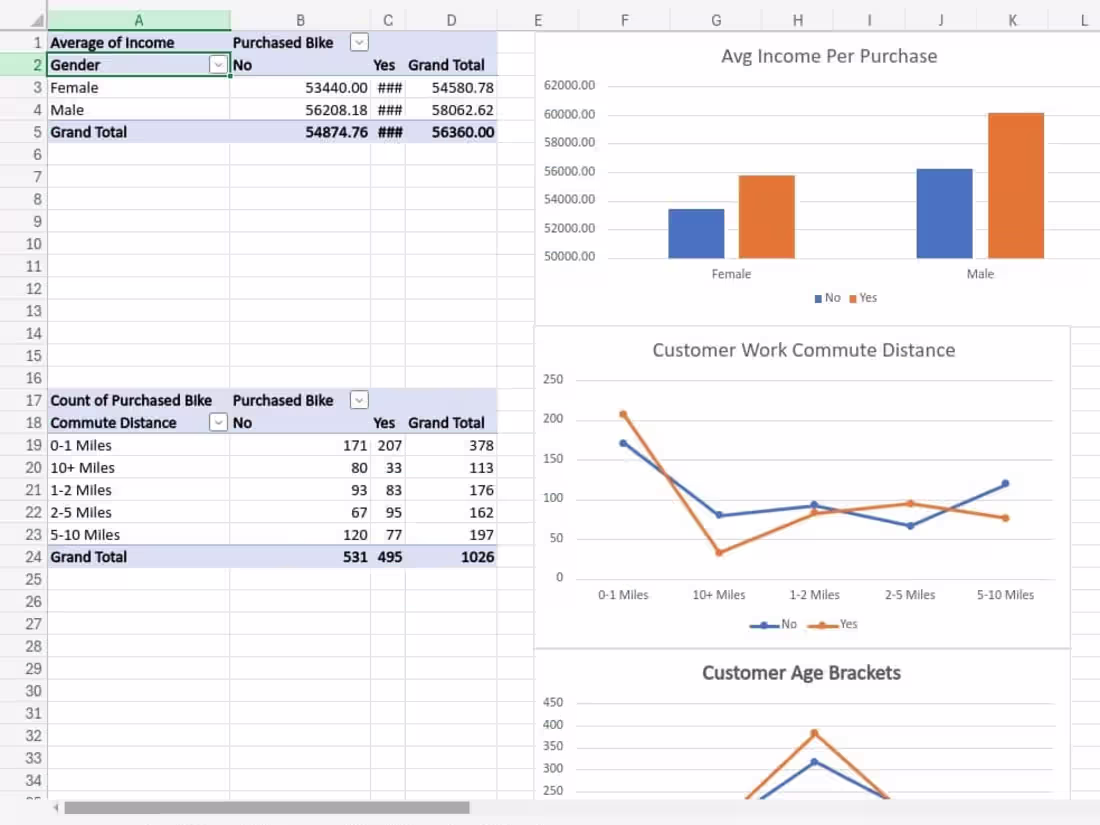
Generate relevant charts, graphs, and data visualizations to support key insights and trends.
Provide summary statistics and other analytical results as agreed upon with the client.
3. Reports and Dashboards:
Create detailed reports summarizing the data analysis findings, including key insights, trends, and actionable recommendations.
Develop interactive dashboards in Excel, utilizing slicers, PivotTables, and other features for dynamic reporting.
4. Final Deliverables:
Provide the client with the final Excel workbook containing all data, analysis, and visualizations.
Share a comprehensive report outlining the methodology, insights, and conclusions of the analysis.
Ensure that all Excel files are fully documented and user-friendly, with clear labeling, descriptions, and instructions if necessary.
5. Revisions and Updates:
Incorporate any feedback or required changes to the deliverables as per the client's instructions.
Provide a final round of updates and ensure that the client is satisfied with the outcome.
6. Support and Guidance:
Offer brief guidance or support on interpreting the data and using the Excel-based tools created.
Provide post-delivery assistance, including clarification of the analysis or adjustments, within an agreed time frame.
nuor's other services
Contact for pricing
Tags
Microsoft Excel
Data Modelling Analyst
Service provided by
nuor Killny Giza, Egypt
Data analysis with excelnuor Killny
Contact for pricing
Tags
Microsoft Excel
Data Modelling Analyst
Data analysis with Excel involves importing, cleaning, and organizing data to derive insights. Key steps include using formulas (e.g., SUM, AVERAGE), creating pivot tables, and applying statistical functions (mean, median, regression). Excel also offers tools for data visualization, such as charts and graphs, and automating tasks with macros. It’s a powerful tool for both simple and advanced data analysis, widely used in business, finance, and research.
What's included
Comprehensive Data Analysis and Reporting using Excel
1. Data Collection and Preparation:
Gather raw data provided by the client or sourced from relevant databases.
Clean and format the data, ensuring consistency, accuracy, and completeness for analysis.
Perform initial data validation to identify and resolve discrepancies or errors.
2. Data Analysis and Visualization:
Use Excel tools (such as PivotTables, Power Query, and formulas) to analyze the data.
Generate relevant charts, graphs, and data visualizations to support key insights and trends.
Provide summary statistics and other analytical results as agreed upon with the client.
3. Reports and Dashboards:
Create detailed reports summarizing the data analysis findings, including key insights, trends, and actionable recommendations.
Develop interactive dashboards in Excel, utilizing slicers, PivotTables, and other features for dynamic reporting.
4. Final Deliverables:
Provide the client with the final Excel workbook containing all data, analysis, and visualizations.
Share a comprehensive report outlining the methodology, insights, and conclusions of the analysis.
Ensure that all Excel files are fully documented and user-friendly, with clear labeling, descriptions, and instructions if necessary.
5. Revisions and Updates:
Incorporate any feedback or required changes to the deliverables as per the client's instructions.
Provide a final round of updates and ensure that the client is satisfied with the outcome.
6. Support and Guidance:
Offer brief guidance or support on interpreting the data and using the Excel-based tools created.
Provide post-delivery assistance, including clarification of the analysis or adjustments, within an agreed time frame.
nuor's other services
Contact for pricing