
Data analysis and visualisationHimanshu Narwal
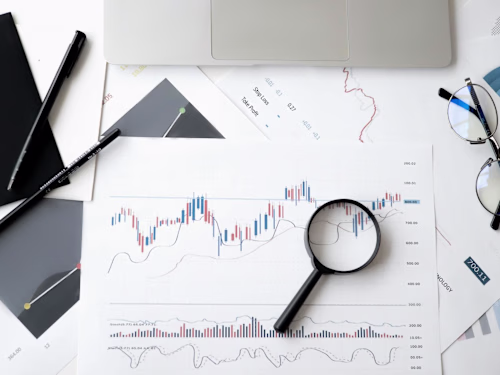
Analysing datasets to extract meaningful insights and creating visual representations (e.g., dashboards, graphs).
What's included
Data analysis report
A comprehensive document detailing the findings from the data analysis.
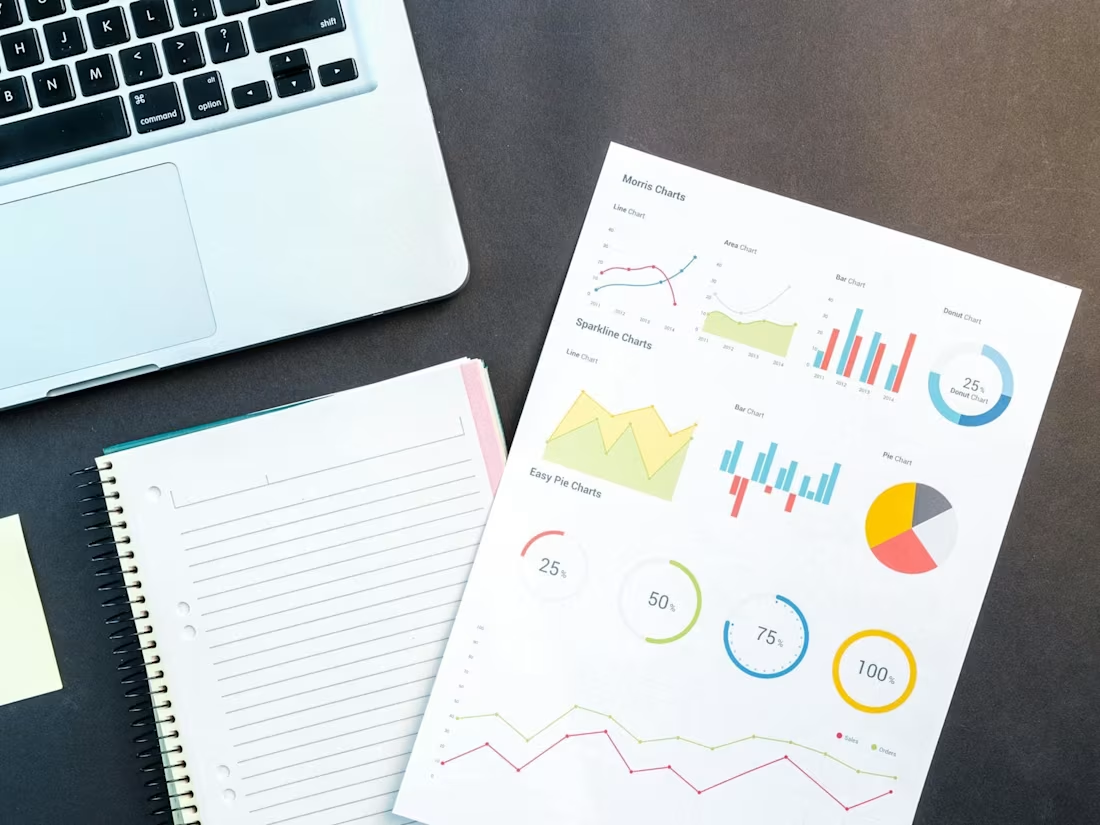
Visualisations and dashboards
Interactive and static visualisations that present the data in a clear and understandable way.
Data files
Cleaned and processed data files that can be used for further analysis or record-keeping.
Presentation slides
A presentation summarising the analysis and findings, suitable for stakeholders.
Code and notebooks
Reproducible code and computational notebooks used during the analysis.
Example work

Himanshu's other services
Contact for pricing
Tags
Jupyter
Matplotlib
pandas
Python
seaborn
Data Analyst
Data Scientist
Data Visualizer
Service provided by
Himanshu Narwal Delhi, India
- 1
- Followers
Data analysis and visualisationHimanshu Narwal
Contact for pricing
Tags
Jupyter
Matplotlib
pandas
Python
seaborn
Data Analyst
Data Scientist
Data Visualizer
Analysing datasets to extract meaningful insights and creating visual representations (e.g., dashboards, graphs).
What's included
Data analysis report
A comprehensive document detailing the findings from the data analysis.
Visualisations and dashboards
Interactive and static visualisations that present the data in a clear and understandable way.
Data files
Cleaned and processed data files that can be used for further analysis or record-keeping.
Presentation slides
A presentation summarising the analysis and findings, suitable for stakeholders.
Code and notebooks
Reproducible code and computational notebooks used during the analysis.
Example work
Himanshu's other services
Contact for pricing