
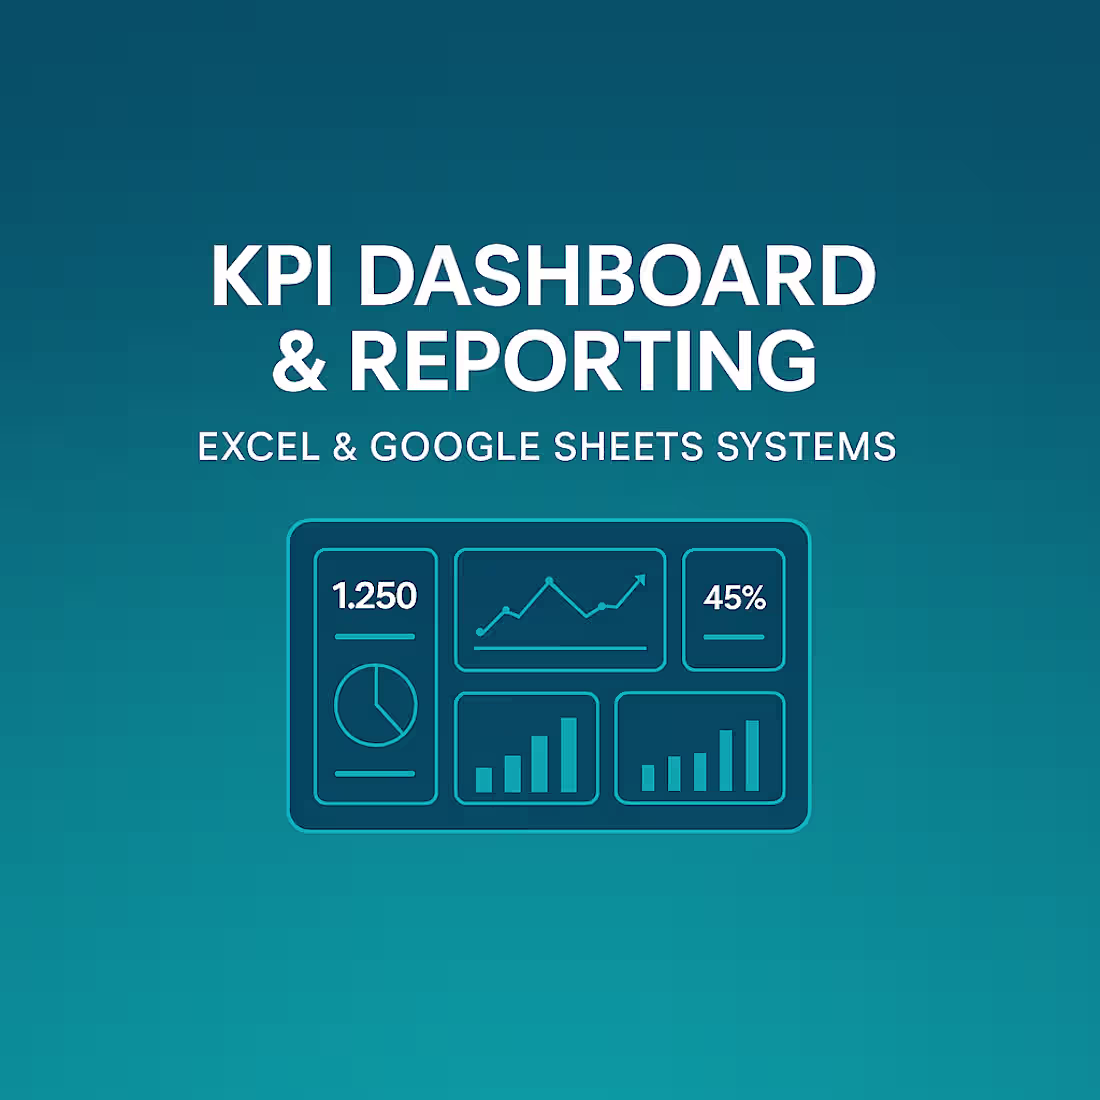
Business KPI Dashboard & Reporting System(Excel / Google Sheets)Varghese C
Modern businesses depend on fast, accurate insights — not manual spreadsheets. I help teams automate their Excel/Google Sheets workflows and build clean, intuitive dashboards that simplify reporting and improve decision-making.
With structured formulas, automation logic, and clear visual design, I transform raw or repetitive data processes into efficient systems that update automatically and highlight the information that matters most. The result is a streamlined workflow and a dashboard that gives you clarity at a glance.
You will receive automated calculations, KPI summaries, interactive visuals, organized tables, and a user-friendly dashboard layout that makes your data easy to understand and act on. This service is ideal for founders, consultants, analysts, and operations teams who want to eliminate manual work, improve accuracy, and gain better visibility into business performance.
If you need a reliable, professionally built dashboard or automated spreadsheet that delivers clear insights and saves valuable time — I’m here to help.
What's included
Automated Excel / Google Sheets File
A fully automated spreadsheet built using advanced formulas and structured logic. Your calculations will update automatically without manual intervention, ensuring speed, accuracy, and error-free workflows.
Business Dashboard (Basic–Intermediate Level)
A clean, visual dashboard showing key metrics, summaries, and insights using charts, KPI cards, conditional visuals, and structured layouts. Designed for quick decision-making and simplified reporting.
Advanced Formula Setup
Implementation of essential functions such as VLOOKUP/XLOOKUP, INDEX/MATCH, SUMIF/SUMIFS, IF/IFS, COUNTIF/COUNTIFS, date functions, and text functions to build dynamic, automated workflows inside the sheet.
Structured Data Model (Tables & Layout)
Your data will be organized into well-defined tables with proper headers, grouping, and column order. This structure supports consistent refreshes, easier automation, and clear interpretation.
Conditional Formatting System
Color-coded rules for highlighting trends, risks, statuses, or performance indicators. This enhances visibility and helps your team understand insights at a glance.
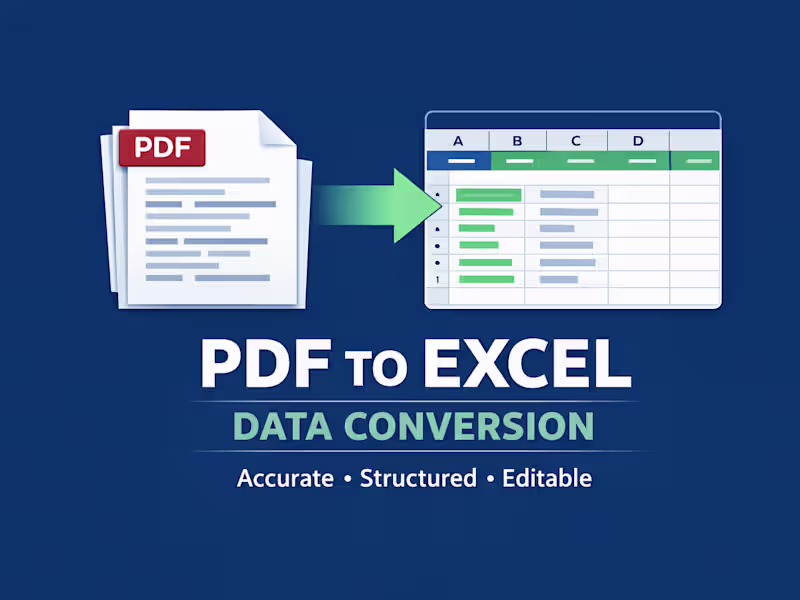
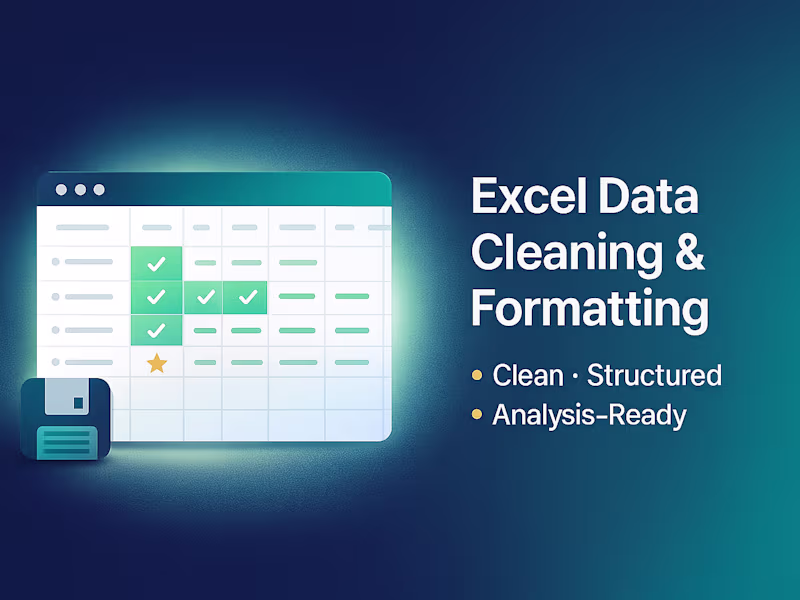
Light Data Cleaning (If Required)
Basic formatting corrections, duplicate removal, and standardization to ensure the automation and dashboard work smoothly. (Major cleaning is handled under Service_02.)
User Guide / Usage Instructions
A short written guide explaining dashboard navigation, key formulas, refresh steps, and how to update inputs correctly.
FAQs
Varghese's other services
Starting at$60
Duration3 days
Tags
Google Sheets
Google Workspace Studio
Microsoft Excel
Microsoft Office 365
Business Workflow Automation
Data Entry Specialist
Data Visualizer
Service provided by
Varghese C Kochi, India
- 6
- Followers
Business KPI Dashboard & Reporting System(Excel / Google Sheets)Varghese C
Starting at$60
Duration3 days
Tags
Google Sheets
Google Workspace Studio
Microsoft Excel
Microsoft Office 365
Business Workflow Automation
Data Entry Specialist
Data Visualizer
Modern businesses depend on fast, accurate insights — not manual spreadsheets. I help teams automate their Excel/Google Sheets workflows and build clean, intuitive dashboards that simplify reporting and improve decision-making.
With structured formulas, automation logic, and clear visual design, I transform raw or repetitive data processes into efficient systems that update automatically and highlight the information that matters most. The result is a streamlined workflow and a dashboard that gives you clarity at a glance.
You will receive automated calculations, KPI summaries, interactive visuals, organized tables, and a user-friendly dashboard layout that makes your data easy to understand and act on. This service is ideal for founders, consultants, analysts, and operations teams who want to eliminate manual work, improve accuracy, and gain better visibility into business performance.
If you need a reliable, professionally built dashboard or automated spreadsheet that delivers clear insights and saves valuable time — I’m here to help.
What's included
Automated Excel / Google Sheets File
A fully automated spreadsheet built using advanced formulas and structured logic. Your calculations will update automatically without manual intervention, ensuring speed, accuracy, and error-free workflows.
Business Dashboard (Basic–Intermediate Level)
A clean, visual dashboard showing key metrics, summaries, and insights using charts, KPI cards, conditional visuals, and structured layouts. Designed for quick decision-making and simplified reporting.
Advanced Formula Setup
Implementation of essential functions such as VLOOKUP/XLOOKUP, INDEX/MATCH, SUMIF/SUMIFS, IF/IFS, COUNTIF/COUNTIFS, date functions, and text functions to build dynamic, automated workflows inside the sheet.
Structured Data Model (Tables & Layout)
Your data will be organized into well-defined tables with proper headers, grouping, and column order. This structure supports consistent refreshes, easier automation, and clear interpretation.
Conditional Formatting System
Color-coded rules for highlighting trends, risks, statuses, or performance indicators. This enhances visibility and helps your team understand insights at a glance.
Light Data Cleaning (If Required)
Basic formatting corrections, duplicate removal, and standardization to ensure the automation and dashboard work smoothly. (Major cleaning is handled under Service_02.)
User Guide / Usage Instructions
A short written guide explaining dashboard navigation, key formulas, refresh steps, and how to update inputs correctly.
FAQs
Varghese's other services
$60