
Data Visualization and ReportingMina Saad
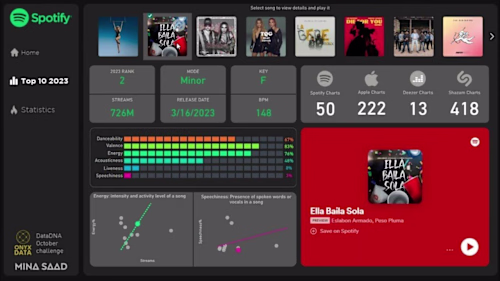
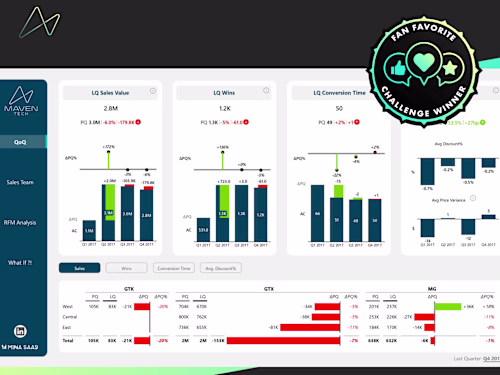
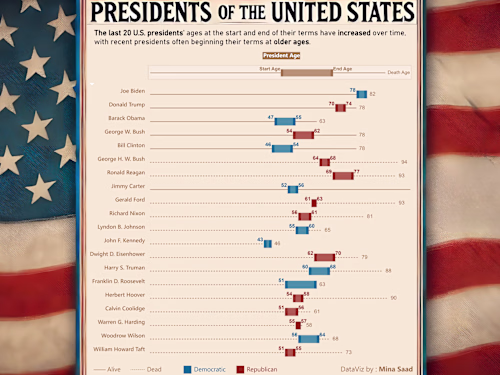
Utilized Tableau and Python to visualize data trends, providing actionable insights for business growth and optimization.
What's included
Data Visualization
I will transform your data into insightful Data visualization
Example work
Mina's other services
Contact for pricing
Tags
D3.js
Matplotlib
Tableau
TensorFlow
three.js
Data Analyst
Data Scientist
Data Visualizer
Service provided by
Mina Saad Egypt
Data Visualization and ReportingMina Saad
Contact for pricing
Tags
D3.js
Matplotlib
Tableau
TensorFlow
three.js
Data Analyst
Data Scientist
Data Visualizer
Utilized Tableau and Python to visualize data trends, providing actionable insights for business growth and optimization.
What's included
Data Visualization
I will transform your data into insightful Data visualization
Example work
Mina's other services
Contact for pricing