
Specialised Grafana Dashboard for end-to-end System MonitoringDhiman Seal
Proactively identifying and addressing incidents is crucial for maintaining system reliability and minimizing downtime. Grafana, a leading open-source analytics and monitoring platform, offers powerful capabilities to create smarter dashboards that enable teams to hunt down and mitigate potential incidents before they have a chance to impact operations.
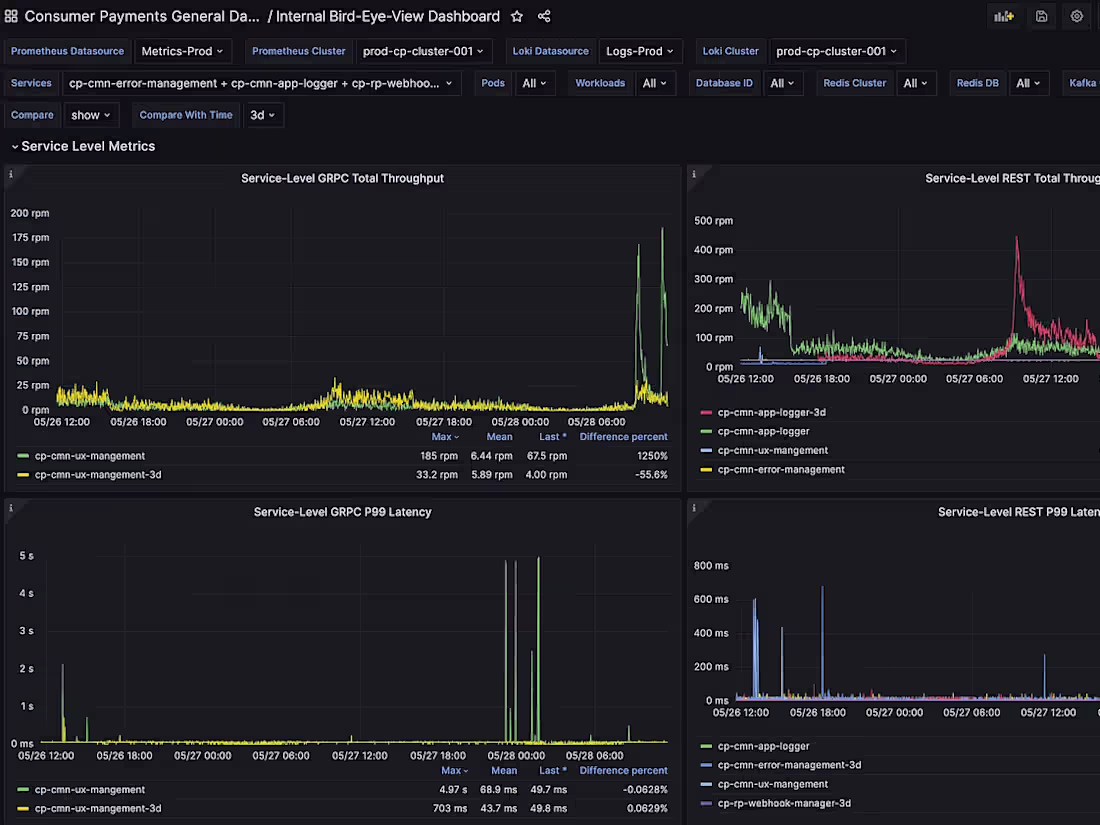
As a Software Engineer with extensive knowledge of OTEL, Prometheus, Grafana, and Observability in general, I will create incredibly smart, reusable dashboards for your system using which you can monitor them end-to-end to track issues before they happen and debug them with ease. To accomplish this, I will set up entire funnels for data ingestion as required.
I will also set up alerts on Grafana for early detection of issues and recovery on relevant alert channels, so you can build your product with ease without worrying about what can break from tech.
What's included
Understanding your system
I look at your codebase and infrastructure to understand what is going on, what is missing, and what needs to be added before sitting to build observability to Grafana.
Ingestion of missing Data Sources and funnels
If Data Sources are missing, I work to get them all integrated. This includes things like OTEL integrations, to data sources (e.g. Prometheus) set up and deployment.
Smart, Reusable Dashboard Creation
I create the Dashboards as required with proper variables and parameters for reusability.
Alert Set Up
Alerts are set up using relevant queries on the relevant channels as requested
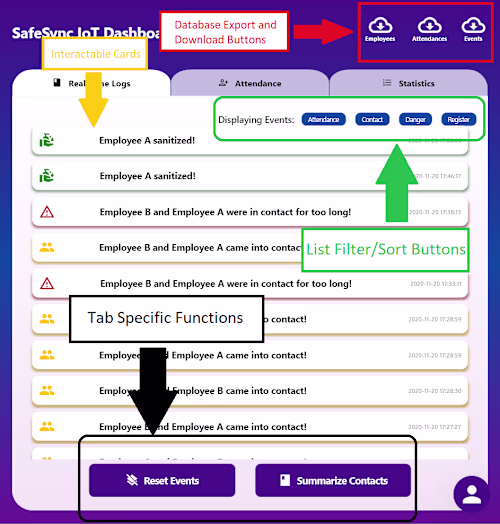
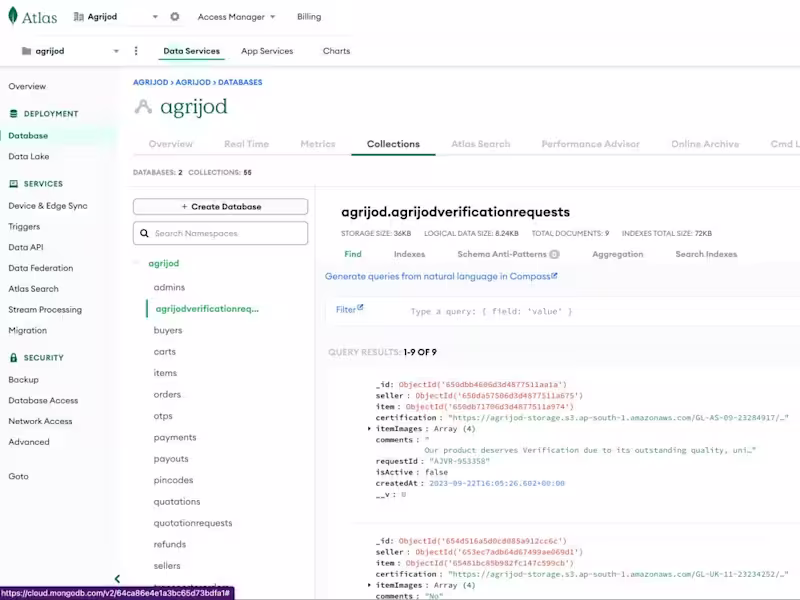
Example work
Dhiman's other services
Starting at$100
Duration2 weeks
Tags
AWS
Elasticsearch
Google BigQuery
Grafana
Prometheus
Fullstack Engineer
Platform Engineer
Software Architect
Service provided by
Dhiman Seal India
- 1
- Followers
Specialised Grafana Dashboard for end-to-end System MonitoringDhiman Seal
Starting at$100
Duration2 weeks
Tags
AWS
Elasticsearch
Google BigQuery
Grafana
Prometheus
Fullstack Engineer
Platform Engineer
Software Architect
Proactively identifying and addressing incidents is crucial for maintaining system reliability and minimizing downtime. Grafana, a leading open-source analytics and monitoring platform, offers powerful capabilities to create smarter dashboards that enable teams to hunt down and mitigate potential incidents before they have a chance to impact operations.
As a Software Engineer with extensive knowledge of OTEL, Prometheus, Grafana, and Observability in general, I will create incredibly smart, reusable dashboards for your system using which you can monitor them end-to-end to track issues before they happen and debug them with ease. To accomplish this, I will set up entire funnels for data ingestion as required.
I will also set up alerts on Grafana for early detection of issues and recovery on relevant alert channels, so you can build your product with ease without worrying about what can break from tech.
What's included
Understanding your system
I look at your codebase and infrastructure to understand what is going on, what is missing, and what needs to be added before sitting to build observability to Grafana.
Ingestion of missing Data Sources and funnels
If Data Sources are missing, I work to get them all integrated. This includes things like OTEL integrations, to data sources (e.g. Prometheus) set up and deployment.
Smart, Reusable Dashboard Creation
I create the Dashboards as required with proper variables and parameters for reusability.
Alert Set Up
Alerts are set up using relevant queries on the relevant channels as requested
Example work
Dhiman's other services
$100