
Data Analysis + VisualizationAngela Yvette Smithers
The goal of this service is to analyze a given dataset, uncover insights, and present findings through clear visualizations to support decision-making or further analysis. Using my design and UI experience to apply visual communication techniques in order to create a more appealing layout for non-data professionals to comprehend clearly what the data is relaying.
What's included
Data Cleaning Report
A summary of steps taken to clean and preprocess the data.
Exploratory Data Analysis (EDA) Report
Insights from initial data exploration, including statistics, trends, and correlations.
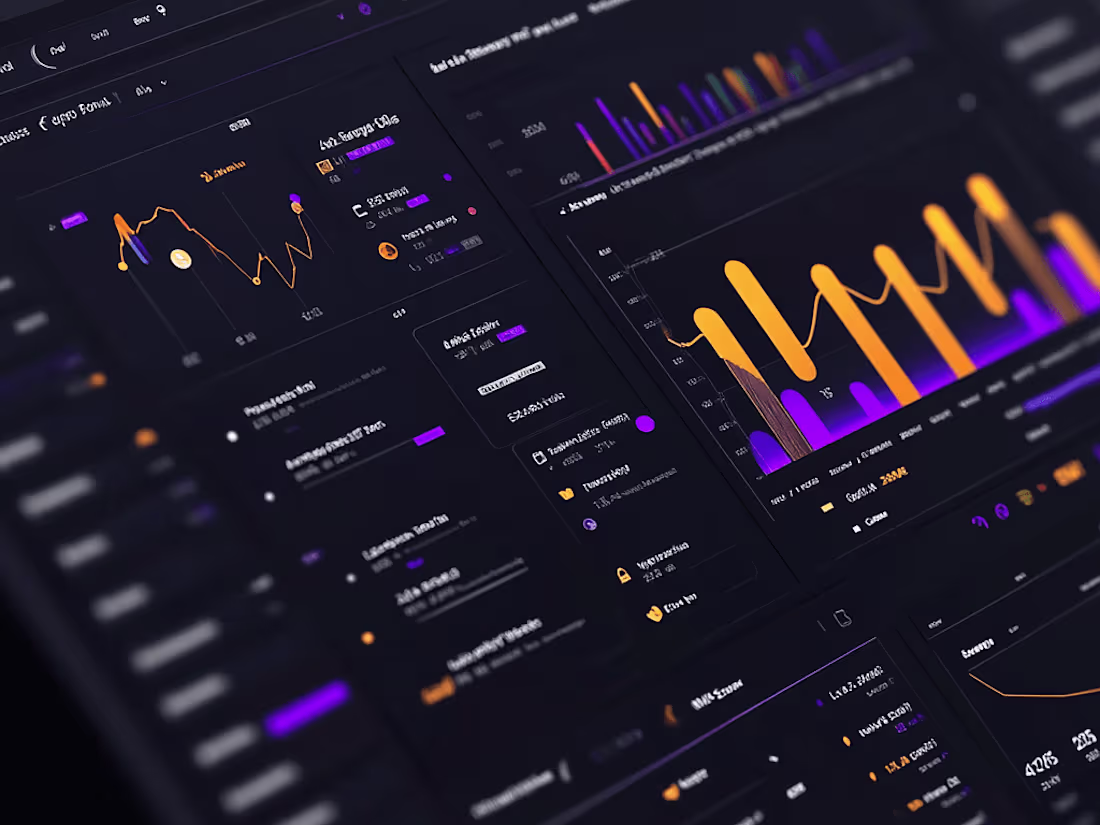
Visualizations
Graphs, charts, and plots that illustrate key findings from the data analysis.
Interactive dashboards (if applicable).
Final Data Analysis Report
A comprehensive report that includes all insights, visualizations, and conclusions drawn from the data.
Angela Yvette's other services

Contact for pricing
Tags
Looker
Microsoft Excel
Microsoft Power BI
Data Analyst
Data Visualizer
Service provided by
Angela Yvette Smithers Washington, USA
Data Analysis + VisualizationAngela Yvette Smithers
Contact for pricing
Tags
Looker
Microsoft Excel
Microsoft Power BI
Data Analyst
Data Visualizer
The goal of this service is to analyze a given dataset, uncover insights, and present findings through clear visualizations to support decision-making or further analysis. Using my design and UI experience to apply visual communication techniques in order to create a more appealing layout for non-data professionals to comprehend clearly what the data is relaying.
What's included
Data Cleaning Report
A summary of steps taken to clean and preprocess the data.
Exploratory Data Analysis (EDA) Report
Insights from initial data exploration, including statistics, trends, and correlations.
Visualizations
Graphs, charts, and plots that illustrate key findings from the data analysis.
Interactive dashboards (if applicable).
Final Data Analysis Report
A comprehensive report that includes all insights, visualizations, and conclusions drawn from the data.
Angela Yvette's other services
Contact for pricing