
Dashboard using power biMoosa Ansari
I create custom Power BI dashboards that transform complex data into clear, interactive, and visually compelling insights for businesses. With expertise in data modeling, DAX calculations, and automation, I ensure that my dashboards are not just visually appealing but also efficient, dynamic, and business-focused. What sets me apart is my ability to deliver tailored solutions that help businesses make data-driven decisions with ease.
What's included
Interactive Power BI Dashboard
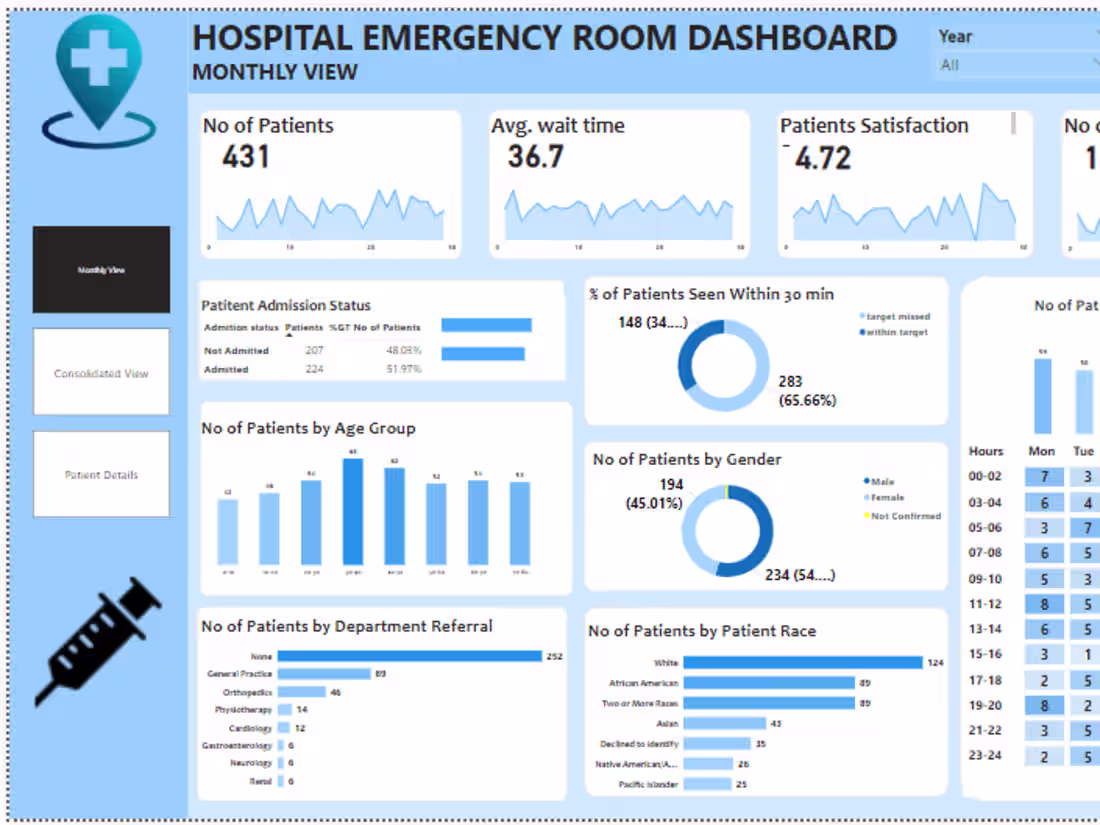
📌 Description: A dynamic and visually compelling Power BI dashboard, tailored to visualize key metrics and business insights.
📌 Format: Power BI file (.pbix) and/or a shareable Power BI Service link
📌 Features:
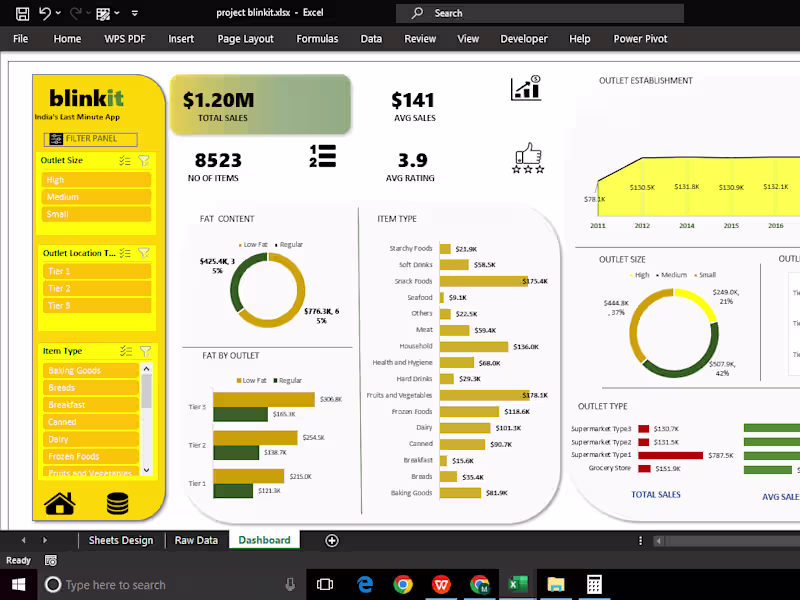
✅ Custom charts, graphs, and KPI indicators
✅ Drill-through, filters, and slicers for interactive exploration
✅ Seamless integration with data sources (Excel, SQL, APIs, etc.)
📌 Revisions: Up to 2 free revisions, additional revisions upon request
Clean & Optimized Data Model
📌 Description: A structured and optimized data model designed for fast, efficient analysis within Power BI.
📌 Format: Integrated within the Power BI file + SQL scripts or Excel files (if applicable)
📌 Features:
✅ Data cleaning and transformation (Power Query, DAX)
✅ Relationship building and normalization for accurate analysis
✅ Documentation of tables, columns, and transformations
📌 Revisions: 2 free revision, extra modifications available as needed
Moosa's other services
Starting at$10
Duration2 days
Tags
Microsoft Power BI
Data Analyst
Data Visualizer
Service provided by
Moosa Ansari Gurugram, India
Dashboard using power biMoosa Ansari
Starting at$10
Duration2 days
Tags
Microsoft Power BI
Data Analyst
Data Visualizer
I create custom Power BI dashboards that transform complex data into clear, interactive, and visually compelling insights for businesses. With expertise in data modeling, DAX calculations, and automation, I ensure that my dashboards are not just visually appealing but also efficient, dynamic, and business-focused. What sets me apart is my ability to deliver tailored solutions that help businesses make data-driven decisions with ease.
What's included
Interactive Power BI Dashboard
📌 Description: A dynamic and visually compelling Power BI dashboard, tailored to visualize key metrics and business insights.
📌 Format: Power BI file (.pbix) and/or a shareable Power BI Service link
📌 Features:
✅ Custom charts, graphs, and KPI indicators
✅ Drill-through, filters, and slicers for interactive exploration
✅ Seamless integration with data sources (Excel, SQL, APIs, etc.)
📌 Revisions: Up to 2 free revisions, additional revisions upon request
Clean & Optimized Data Model
📌 Description: A structured and optimized data model designed for fast, efficient analysis within Power BI.
📌 Format: Integrated within the Power BI file + SQL scripts or Excel files (if applicable)
📌 Features:
✅ Data cleaning and transformation (Power Query, DAX)
✅ Relationship building and normalization for accurate analysis
✅ Documentation of tables, columns, and transformations
📌 Revisions: 2 free revision, extra modifications available as needed
Moosa's other services
$10