
Excel dashboard for data analysisMoosa Ansari
I offer custom Excel dashboards that transform raw data into interactive, easy-to-understand insights using dynamic charts, pivot tables, and automation. My expertise in data visualization, Power Query, and advanced Excel formulas ensures accuracy, efficiency, and a seamless user experience. What sets me apart is my business-focused approach, delivering not just reports but actionable insights tailored to drive data-driven decisions.
What's included
Interactive Excel Dashboard
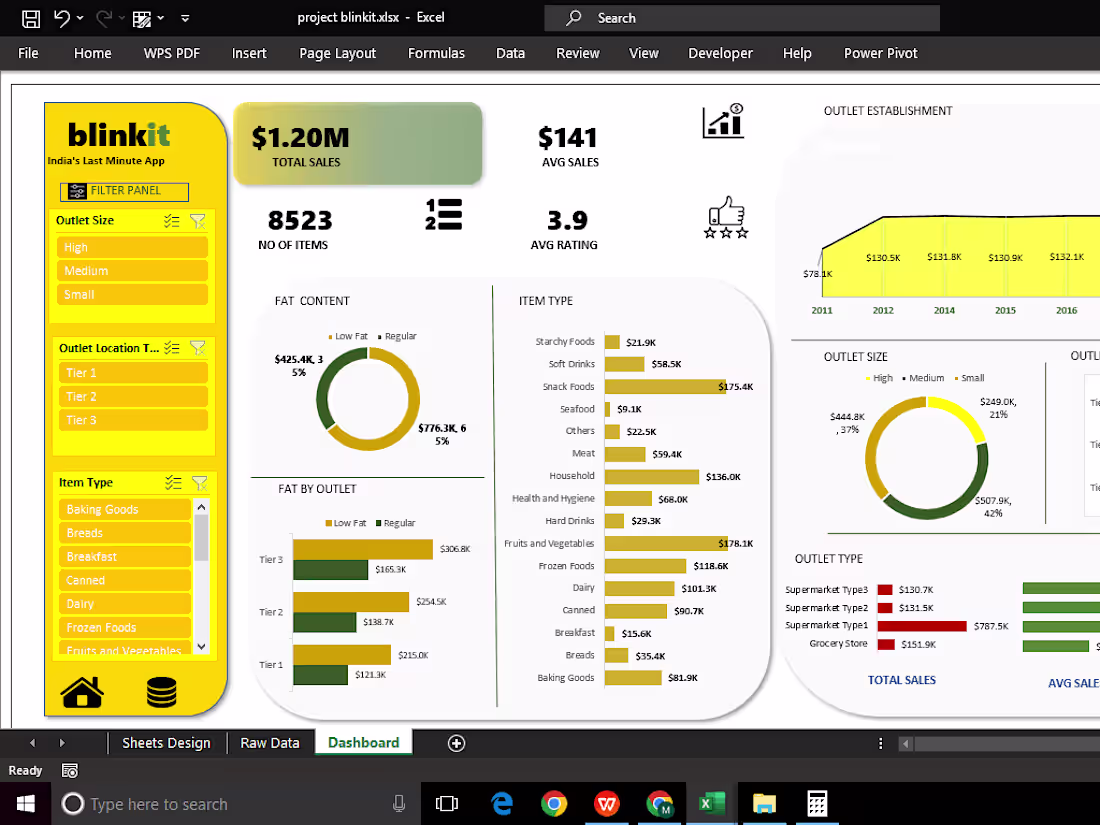
📌 Description: A fully customized, interactive dashboard in Excel, designed to visualize key metrics and trends.
📌 Format: Excel file (.xlsx)
📌 Features:
✅ Dynamic charts, pivot tables, and slicers for easy data filtering
✅ KPI indicators and conditional formatting for quick insights
✅ Automated calculations using formulas, Power Query, and VBA (if needed)
📌 Revisions: Up to 2 free revisions, additional revisions available upon request
Clean & Structured Data File
📌 Description: A properly cleaned and formatted data file used to power the dashboard, ensuring accuracy and consistency.
📌 Format: Excel (.xlsx) or CSV (.csv)
📌 Features:
✅ Removed duplicates, handled missing values, and standardized data
✅ Well-structured tables with named ranges for easy reference
✅ Data validation to maintain consistency
📌 Revisions: 2 free revision, extra modifications can be discussed
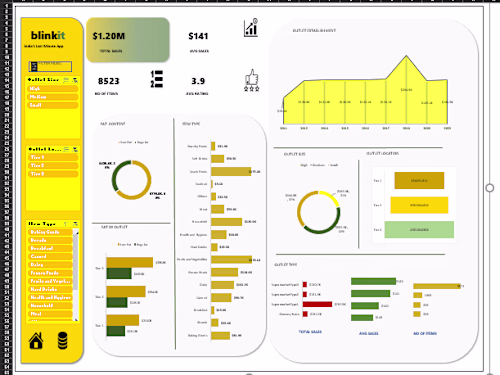
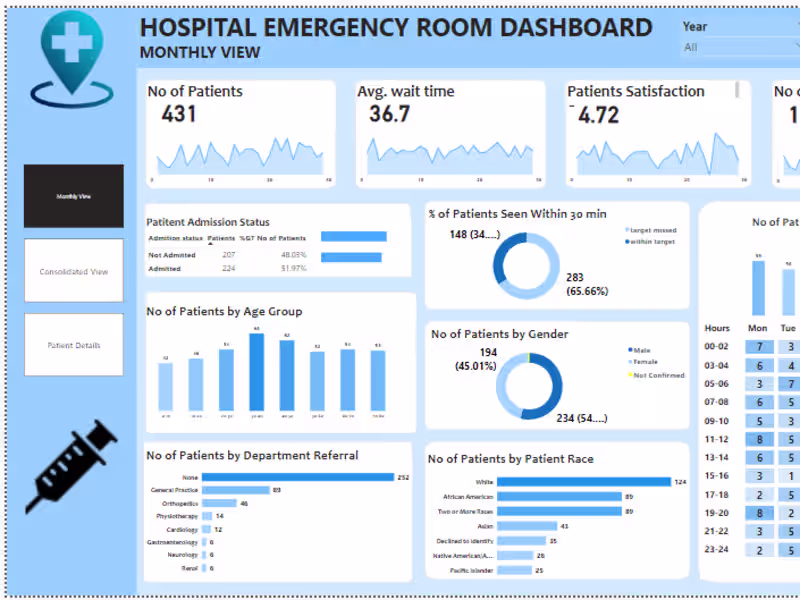
Example work
Moosa's other services
Starting at$15
Duration2 days
Tags
Microsoft Excel
Data Analyst
Data Visualizer
Service provided by
Moosa Ansari Gurugram, India
Excel dashboard for data analysisMoosa Ansari
Starting at$15
Duration2 days
Tags
Microsoft Excel
Data Analyst
Data Visualizer
I offer custom Excel dashboards that transform raw data into interactive, easy-to-understand insights using dynamic charts, pivot tables, and automation. My expertise in data visualization, Power Query, and advanced Excel formulas ensures accuracy, efficiency, and a seamless user experience. What sets me apart is my business-focused approach, delivering not just reports but actionable insights tailored to drive data-driven decisions.
What's included
Interactive Excel Dashboard
📌 Description: A fully customized, interactive dashboard in Excel, designed to visualize key metrics and trends.
📌 Format: Excel file (.xlsx)
📌 Features:
✅ Dynamic charts, pivot tables, and slicers for easy data filtering
✅ KPI indicators and conditional formatting for quick insights
✅ Automated calculations using formulas, Power Query, and VBA (if needed)
📌 Revisions: Up to 2 free revisions, additional revisions available upon request
Clean & Structured Data File
📌 Description: A properly cleaned and formatted data file used to power the dashboard, ensuring accuracy and consistency.
📌 Format: Excel (.xlsx) or CSV (.csv)
📌 Features:
✅ Removed duplicates, handled missing values, and standardized data
✅ Well-structured tables with named ranges for easy reference
✅ Data validation to maintain consistency
📌 Revisions: 2 free revision, extra modifications can be discussed
Example work
Moosa's other services
$15