
Fintech Web App or Financial Dashboard BuildZoha Ahmed
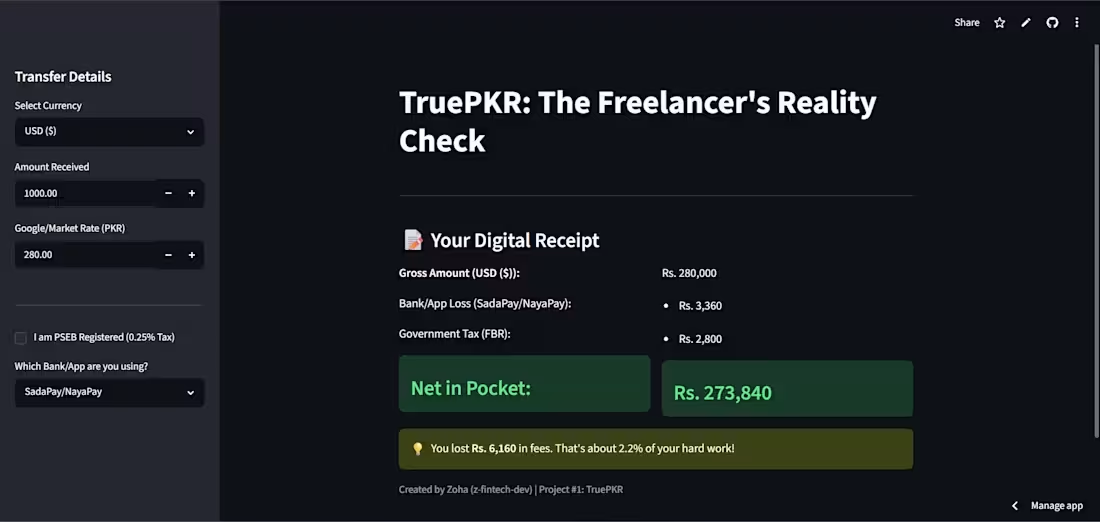
You have financial data and no good way to look at it. Maybe it's transaction exports, payment records, or numbers spread across a bank portal and three spreadsheets. You need a real interface — one that does the calculation correctly and shows its work.
That's what I build. Not a chart library pointed at a CSV, but an actual application: data ingestion that survives messy real-world exports, calculation logic you can verify, and an interface someone will still be using in six months.
Who this is for
Founders, fintech teams, and finance-adjacent businesses who need a working tool rather than a design mockup. Especially useful if your calculation logic is the hard part — fee structures, tax tiers, multi-currency, burn and runway.
How I work
Scope call. You show me the data and describe the decision the tool needs to support. Most of the value gets decided here — a dashboard that answers the wrong question is expensive no matter how it looks.
Data model and calculation logic first. I get the math right and verifiable before any interface exists. Financial tools live or die on whether a user can interrogate a number they don't trust.
Interface build. Responsive, fast, built around the one thing you actually need to see.
Handoff. Deployed, with the code and a walkthrough of how the calculations work.
What makes this different
I build financial tools that explain themselves. Every number a user sees can be traced back to the inputs that produced it — no black boxes, no "trust me" figures. That principle runs through everything in my portfolio, and it's the reason these tools get used rather than opened once and abandoned.
FAQs
Zoha's other services
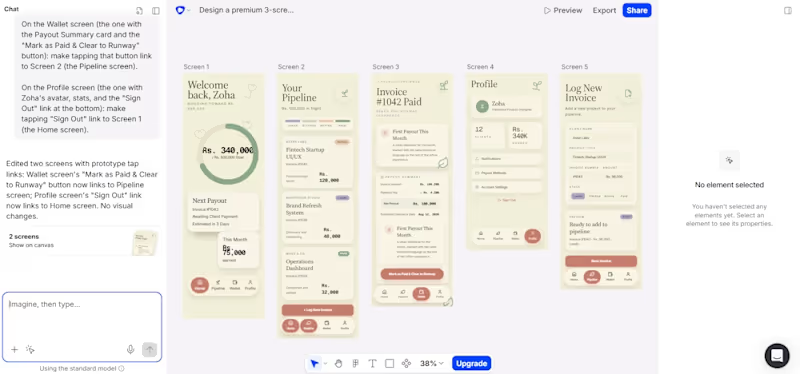

Starting at$1,200
Duration3 weeks
Tags
Dashboard Design
Python

React

Data Visualizer
Web Developer
Fintech
Service provided by
Zoha Ahmed Karachi, Pakistan
- 1
- Followers
Fintech Web App or Financial Dashboard BuildZoha Ahmed
Starting at$1,200
Duration3 weeks
Tags
Dashboard Design
Python
React
Data Visualizer
Web Developer
Fintech
You have financial data and no good way to look at it. Maybe it's transaction exports, payment records, or numbers spread across a bank portal and three spreadsheets. You need a real interface — one that does the calculation correctly and shows its work.
That's what I build. Not a chart library pointed at a CSV, but an actual application: data ingestion that survives messy real-world exports, calculation logic you can verify, and an interface someone will still be using in six months.
Who this is for
Founders, fintech teams, and finance-adjacent businesses who need a working tool rather than a design mockup. Especially useful if your calculation logic is the hard part — fee structures, tax tiers, multi-currency, burn and runway.
How I work
Scope call. You show me the data and describe the decision the tool needs to support. Most of the value gets decided here — a dashboard that answers the wrong question is expensive no matter how it looks.
Data model and calculation logic first. I get the math right and verifiable before any interface exists. Financial tools live or die on whether a user can interrogate a number they don't trust.
Interface build. Responsive, fast, built around the one thing you actually need to see.
Handoff. Deployed, with the code and a walkthrough of how the calculations work.
What makes this different
I build financial tools that explain themselves. Every number a user sees can be traced back to the inputs that produced it — no black boxes, no "trust me" figures. That principle runs through everything in my portfolio, and it's the reason these tools get used rather than opened once and abandoned.
FAQs
Zoha's other services
$1,200